Today marks the first day of Dashboard week for DS32, DSNY1 & DSDE3. Exciting times!
Andy Kreibel the Tableau Visionary set our task which was outlined as such:

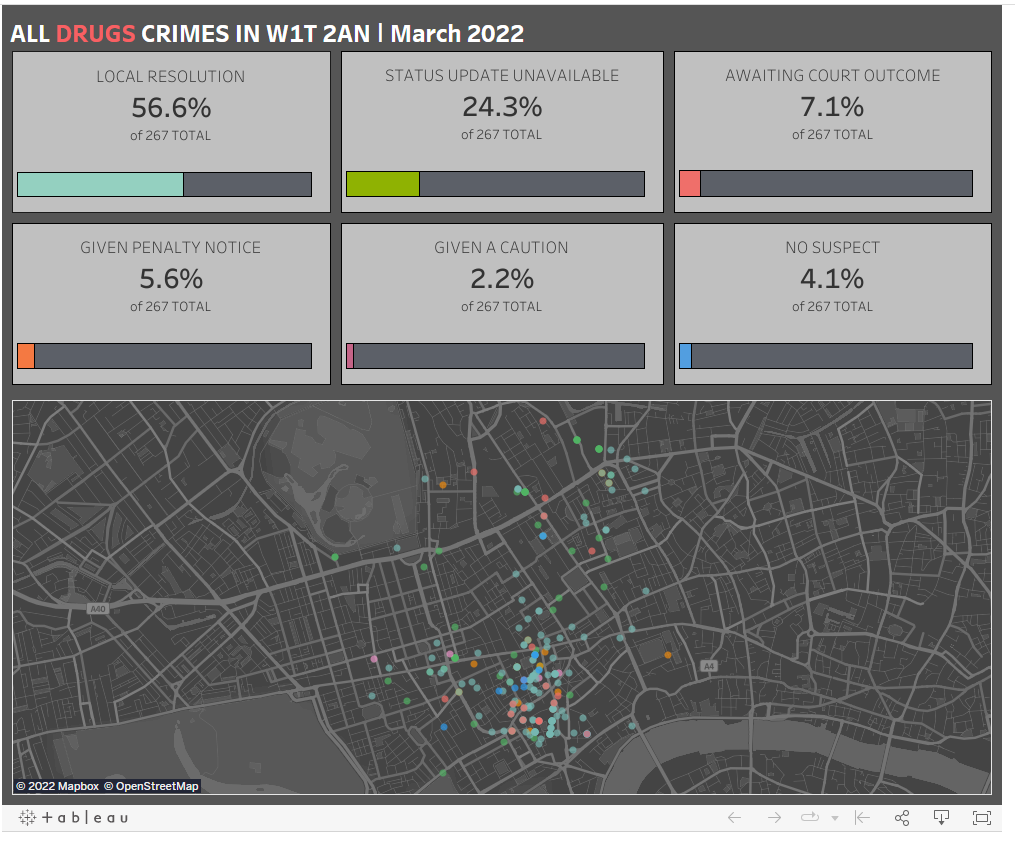
For a Monday morning, I was somewhat sidetracked when I discovered I had to build an Alteryx app that pulls data from an API at the early hours of the day. However, I was able to create a dashboard that changed depending on what was put into the app which changed on three sections: month, category and postcode.
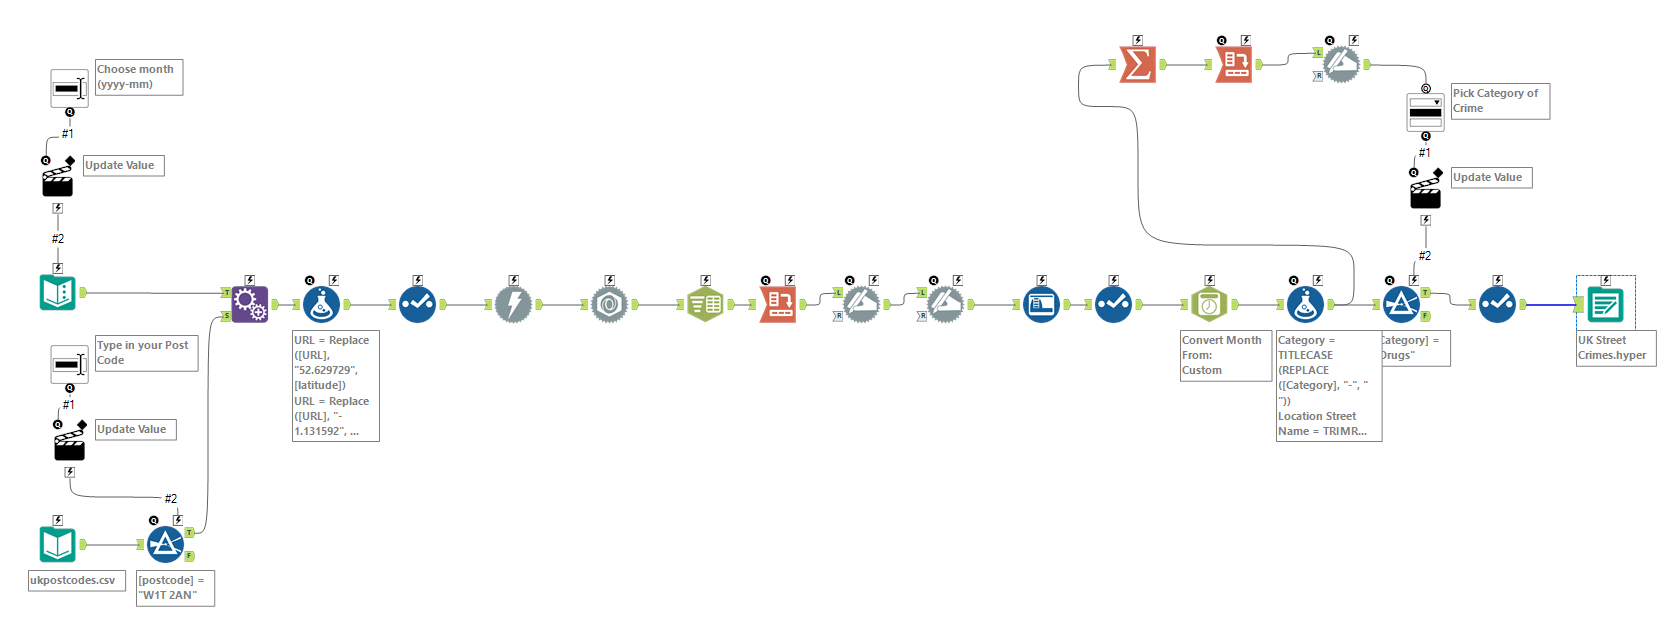
The workflow consisted of two inputs. A text input which held the API call URL, and an input from data.freemaptools.com which held every post code within the UK (roughly 1.7 million postcodes apparently). I allow the user to choose which postcode they want through a text box which filters out that postcode input and appends the latitude and longitude of its' postcode into the API URL. Another text box is also added to the first API URL text input to let the user change the month and year they would like.
The download tool then pulls in the json from the API and I parse the data. I then allow the user to choose a category through a drop down interface tool. The output file writes the dataset as a .hyper file to my PC.
I then went on Tableau to create the KPI dashboard, where I used the six "Outcomes" as KPIs and a map to show the locations of each crime.
Things I would have liked to do:
- I would have to liked to find a way of making a date range instead of choosing a single month, I know that some of my colleagues were able to do this.
- I also would want to output the file to a google sheets file so that it could also update my dashboard on Tableau Public, however, I felt like I didn't have enough time so I had to change the scope of my project accordingly.