


Having been away from the Data School since Tuesday (attending my sister’s wedding), I returned to day 4 of Dashboard Week with a challenge of downloading the nutritional information csv’s for 457 different colas on the USDA website.
What initially sounded like an easy task ended up being a tricky, irritating and ‘fun’ challenge as each of the cola’s had a separate web page that contained all of their nutritional information…. #FacePalm
Going into this, I did not know where to start or how I would go about pulling all of this information and spent a good while going over different ways that I could get all of the web links for each cola until Alex Jones mentioned a handy tool called Link Klipper which is a Google Chrome extension that downloads all of the web links on a web page and puts them into a .csv file which requires minimal preparation prior to bringing into Alteryx.
This tool alone saved me so much time as I originally planned to go to each website and copy and paste the web links into an Excel file 1 at a time…. which would have taken a good while since there were well over 400 different pages to go through.
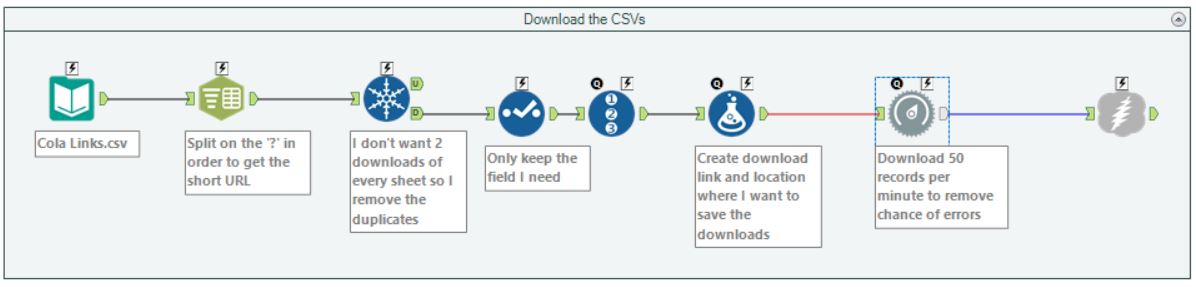
Once I had all of the web links I needed in a single file, I then moved on to Alteryx to begin creating a formula that allows me to set Alteryx to download the .csv files rather than download the tables. I used the below workflow to complete this task and would like to point out a cool tool that I have never used before – ‘Throttle Tool’. This tool allows the user to set a number of records to download per minute which came in handy as when I was trying to download the 457 .csv files at one go I kept getting errors because the website couldn’t handle the large amounts of downloads that I was trying to do.
After some trial and error, I managed to find the perfect number of records to download per minute (50) which allowed me to get all of the .csv files without any trouble.
I could now move on to the lengthy process of cleaning the files as the format they came in wasn’t very pleasant as you can see below:
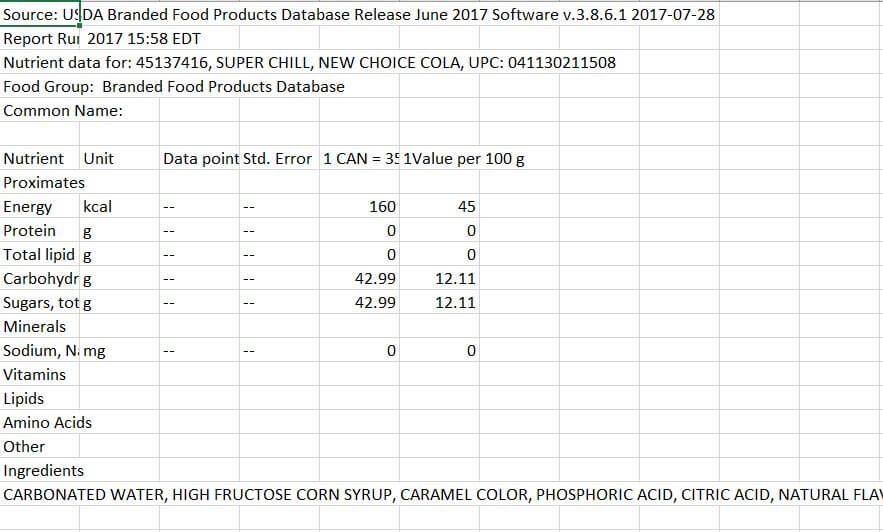
Fortunately, every file I downloaded came in the exact same format, so I could use the same process to clean all of the other documents.
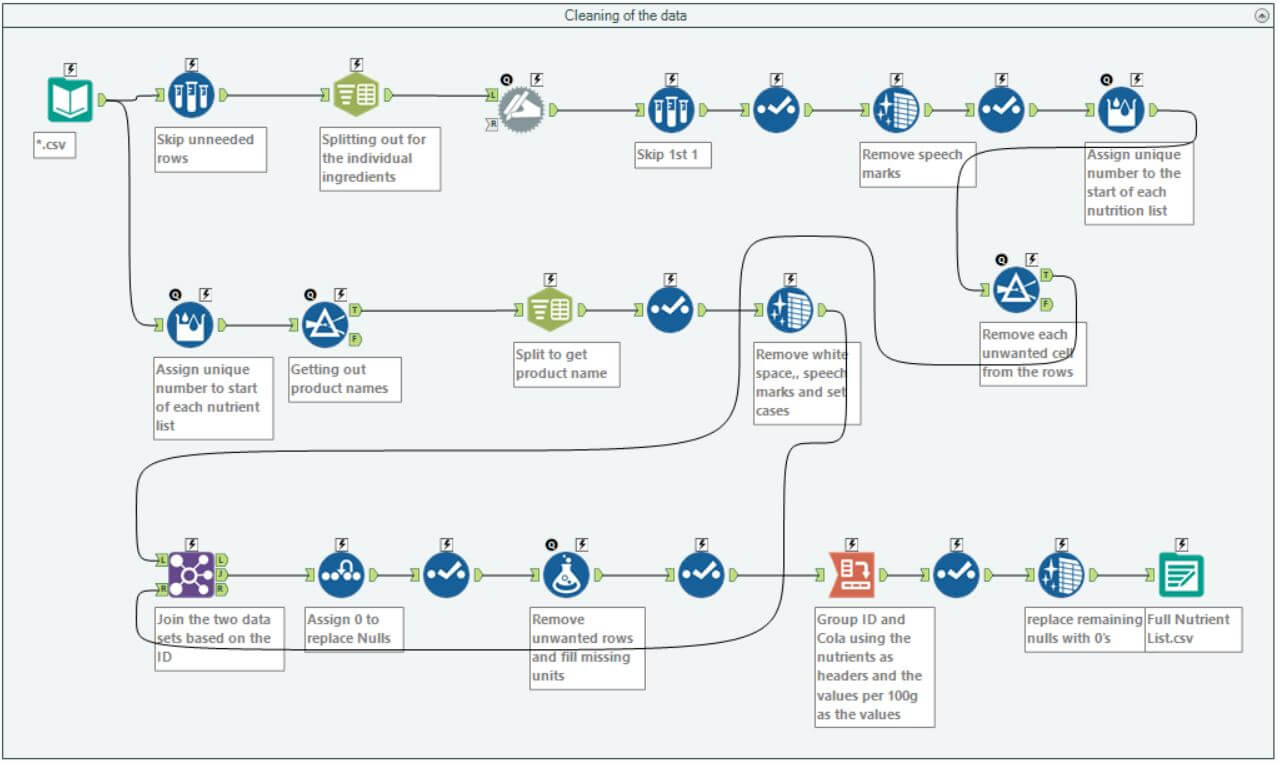
By using the input tool and changing the end of the file location to *.csv, I was able to pull in all documents into Alteryx in one go and run the below workflow to clean them up to be used in Tableau.
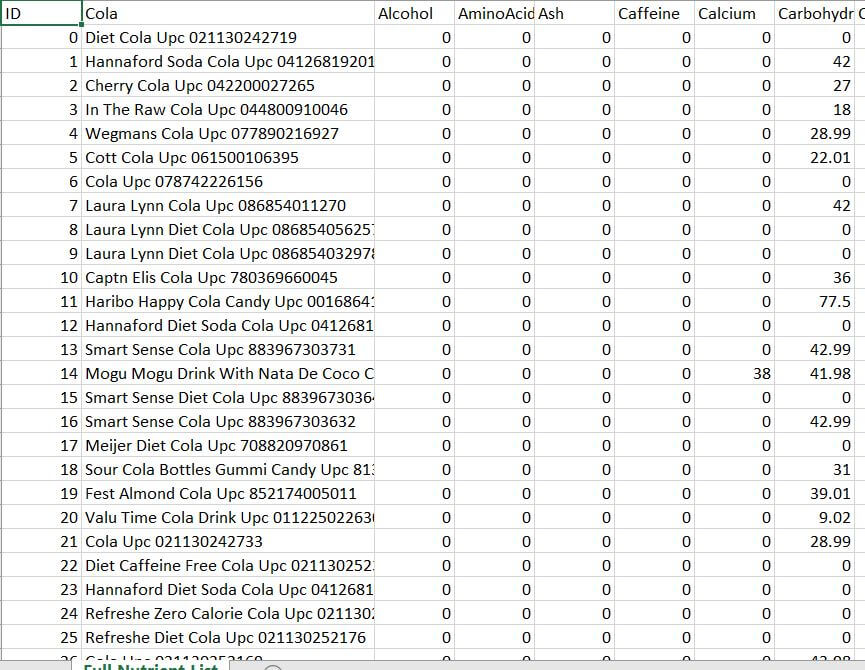
This was a challenge in itself as the documents contained so much data that was all over the place but achieving the end result gave me a great sense of achievement knowing that this beast had been tamed and the below is a sample of what came out the other end.
I will now begin to build a Tableau visualisation based on this data and will include this in my next blog.
Hope you find this useful.
MG