We all know that "human-readable" data, does not necessarily mean, machine friendly. And I am sure we all found ourselves in situations when we needed to translate a nice looking Excel table, into a structure Tableau Prep or any other data preparation tool would understand. At least I most certainly did a couple of weeks ago on one of our weekly client projects.
Data
I was working on a dataset focused on Swiss tourism products breakdown in terms of gross value added, direct demand and tourism employment. The dataset is available here, in case you want to follow along. This is one of the Excel tables:

For us, it is easy to distinguish the data as being hierarchical in nature. We realize that "A. Consumption Products" is made up by adding "A.1 Tourism-characteristic products" and "A.2 Tourism-connected products". And that "A.1 Tourism-characteristic products" can be further broken down to individual tourism product groups, numbered 1-7. However, this is not what Tableau Prep sees. In fact, it does not distinguish between different categories, nor aggregates and brings back everything under the same column.

This is a problem because some of these rows are aggregates of other rows. For instance "A. Consumption Products" is an aggregate of "A.1 Tourism-characteristic products" and "A.2 Tourism-connected products". If we sum A, A1 and A2 together, we will be double counting and blowing up our results, because:
A1 + A2 = A
A + A1 + A2 = 2A
Therefore, we need to tell Tableau Prep that this is hierarchical data. We can do so by getting rid of the aggregated rows and creating a few categorical columns that break this view down into different categories and products.
But first, we need to understand the structure of the data.
Data Structure
There are three main categories within the data:
- Top Level Category (incl. A. Consumption products and B. Non tourism-specific products)
- Sub-Category - a further drill-down of A. Consumption products (incl. A.1 Tourism-characteristic products and A.2 Tourism-connected products)
- Product Groups - a further drill-down of A.1 Tourism-characteristic products (incl. product groups numbered 1-7)

We could also further break down some of the product groups into individual products. For example, accommodation product group could be split into Hotels and Other. However, due to the purpose of this demonstration and the fact that not all of the product groups are further broken down into individual products, I decided to avoid breaking the data further and instead chose my product group as my least granular category.
When working with hierarchical data, it is also important to think about fields or patterns that represent that hierarchy. In our case, it is the first three or four characters. We can see that Consumption Products has "A. " next to it and that Non tourism-specific products have "B. ", or that each individual product group has a number as a first character, space as a second, dash as a third and space as a fourth character. When creating the hierarchy we can call these values and give them different categories based on these patterns.
Here is my Tableau Prep flow which I will discuss in more detail below:

Step 1: getting data into the right format*
First, I bring data in with a wildcard union, to get the data for each of the years and clean it using Data Interpreter. This is followed by a clean step that removes and renames some of the columns. There also were some issues with 2020 data being assigned to different columns, so I created a calculated field to populate these back to the fields they belong to. Lastly, I removed more columns with another clean step, before starting to work with the hierarchy.
* I did not go into detail for this step because it is not the topic of the blog, but you can download already formatted data here.
Step 2: creating the hierarchy
2.1 Getting rid of Totals

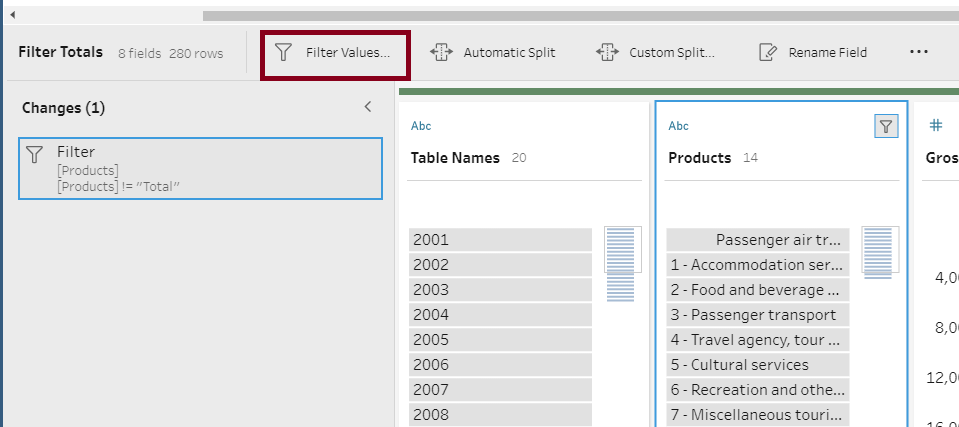
The first thing I do is getting rid of the Totals aggregate from the Products column. I do so with a filter within my first clean step:

You can apply a filter by choosing a field from the profile pane and clicking the Filter Values option on the top toolbar:

2.2 Creating the Top Level Category
First, we need to know whether there are any rows we want to get rid of. In our case, there are. Even though "A. Consumption Products" represents the total number of products classed as consumption products, it is an aggregate, and by assigning it a categorical value we would be blowing up our data. Therefore, we need to get rid of this row and other aggregated rows. However, before we get rid of these rows, we also need to assign the aggregate row name to the values further down the hierarchy that makes up the aggregate.
We also won't need "A.1 Tourism-characteristic products", as it is an aggregate as well, nor we will need the values that go into deeper granularity than we want (i.e. hotels or passenger air transport). Taking all of the above into consideration our calculation would look like this;

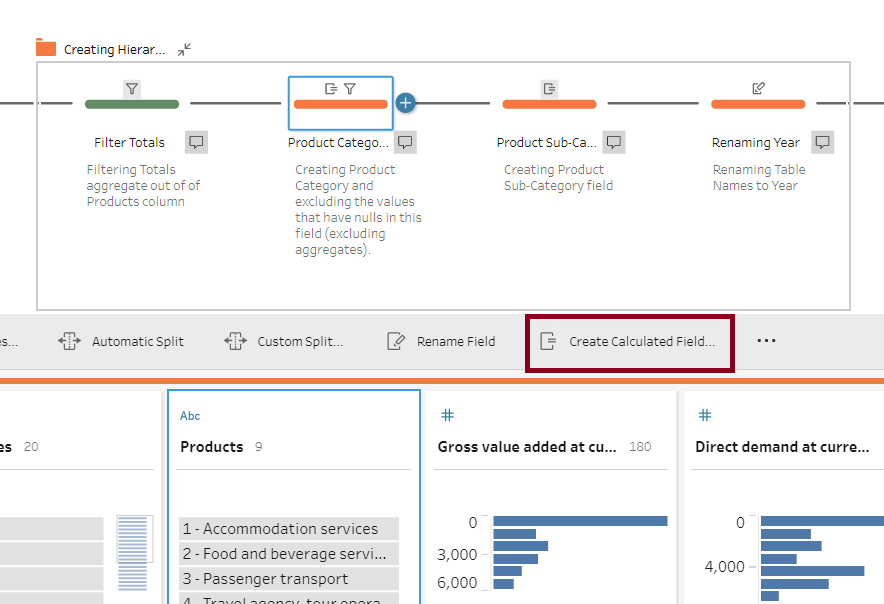
First, we are isolating the "B. Non-tourism specific products" row, which does not have any further drill down. For the rest of the rows, we give a "Consumption Products" category. There are also additional if statements that assign nulls to the rows with aggregates and further granularity we don't need (we can later call these null values and filter the records out).
You can easily apply calculations to your fields by selecting a field on the profile pane and choosing Create Calculated Field option on the top menu bar:

After we apply this calculation, this is what we get:

Next, we apply the null filter:

The result:

The result is our desired product groups with a top-level category assigned to them In a different column.
2.3 Creating Sub-Category
Each of our product groups is within a sub-category called "A.1 Tourism-characteristic products", so we need to create a separate column with this sub-category assigned to each of the product groups. However, within that column, we should also have a value for another sub-category, "A.2 Tourism-connected products", as well as a value for our other top-level category, "B. Non tourism-specific products". We can do so with this calculation:

Within calculation, we are telling Tableau Prep to look at the Product Category field and if it is anything else apart from Consumption Products, assign it a null value. If it is Consumption Products then look for the field that starts with "A.2" and give it a name of Tourism-connected products (isolating the value with no further drill-down), else name it Tourism-characteristic products.
The result:

We can see that one of our top-level categories was assigned a null value. If the value does not have a further option of drilling down, we want to take its value from the category above it. In this case, Product Category:

The final result:

After this, I created another clean step where I renamed the "Table Names" column to "Year". The last thing left to do was to output the data, bring it to Tableau and build a quick visualization based on this hierarchy:

Link to the final viz here.
Link to the Tableau Prep Flow here.
