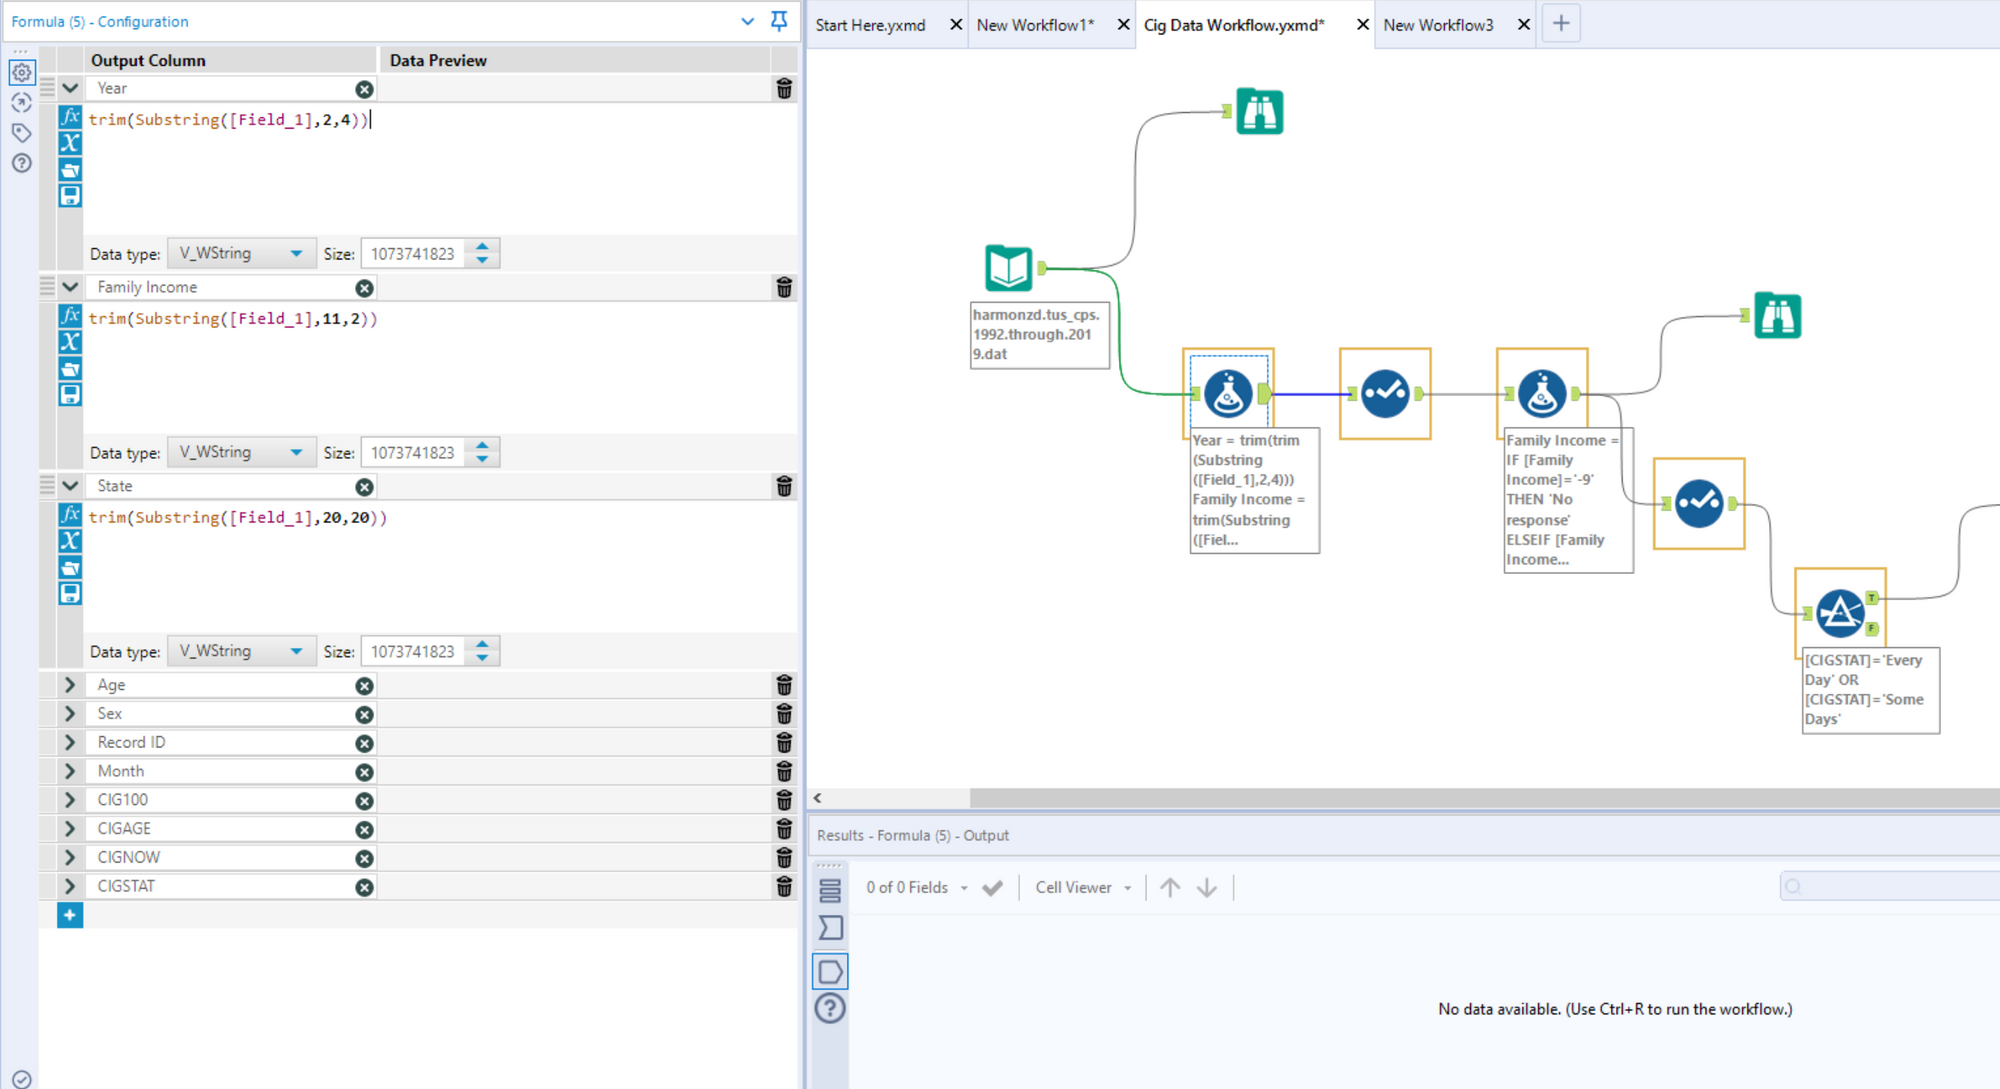
Today we were challenged to build a dashboard using US Census Data related to tobacco use. The first problem I faced was handling the .dat file format the data came in. The solution was the set the Input Data tool in Alteryx to read it in as a fixed width, where the width was set to 701 characters (the maximum number of total characters in one record). Configured this way, Alteryx read in all the data from each record into a single cell. Since each record contained answers to around 200 census questions, there was then a lot of manual work to do pull out the relevant data from each field. Since we only had the morning to work on this, I chose a handful of basic demographic fields (age, sex, income etc) along with a few fields related to tobacco usage. Once complete, I output the file as a .hyper file ready for work in Tableau.
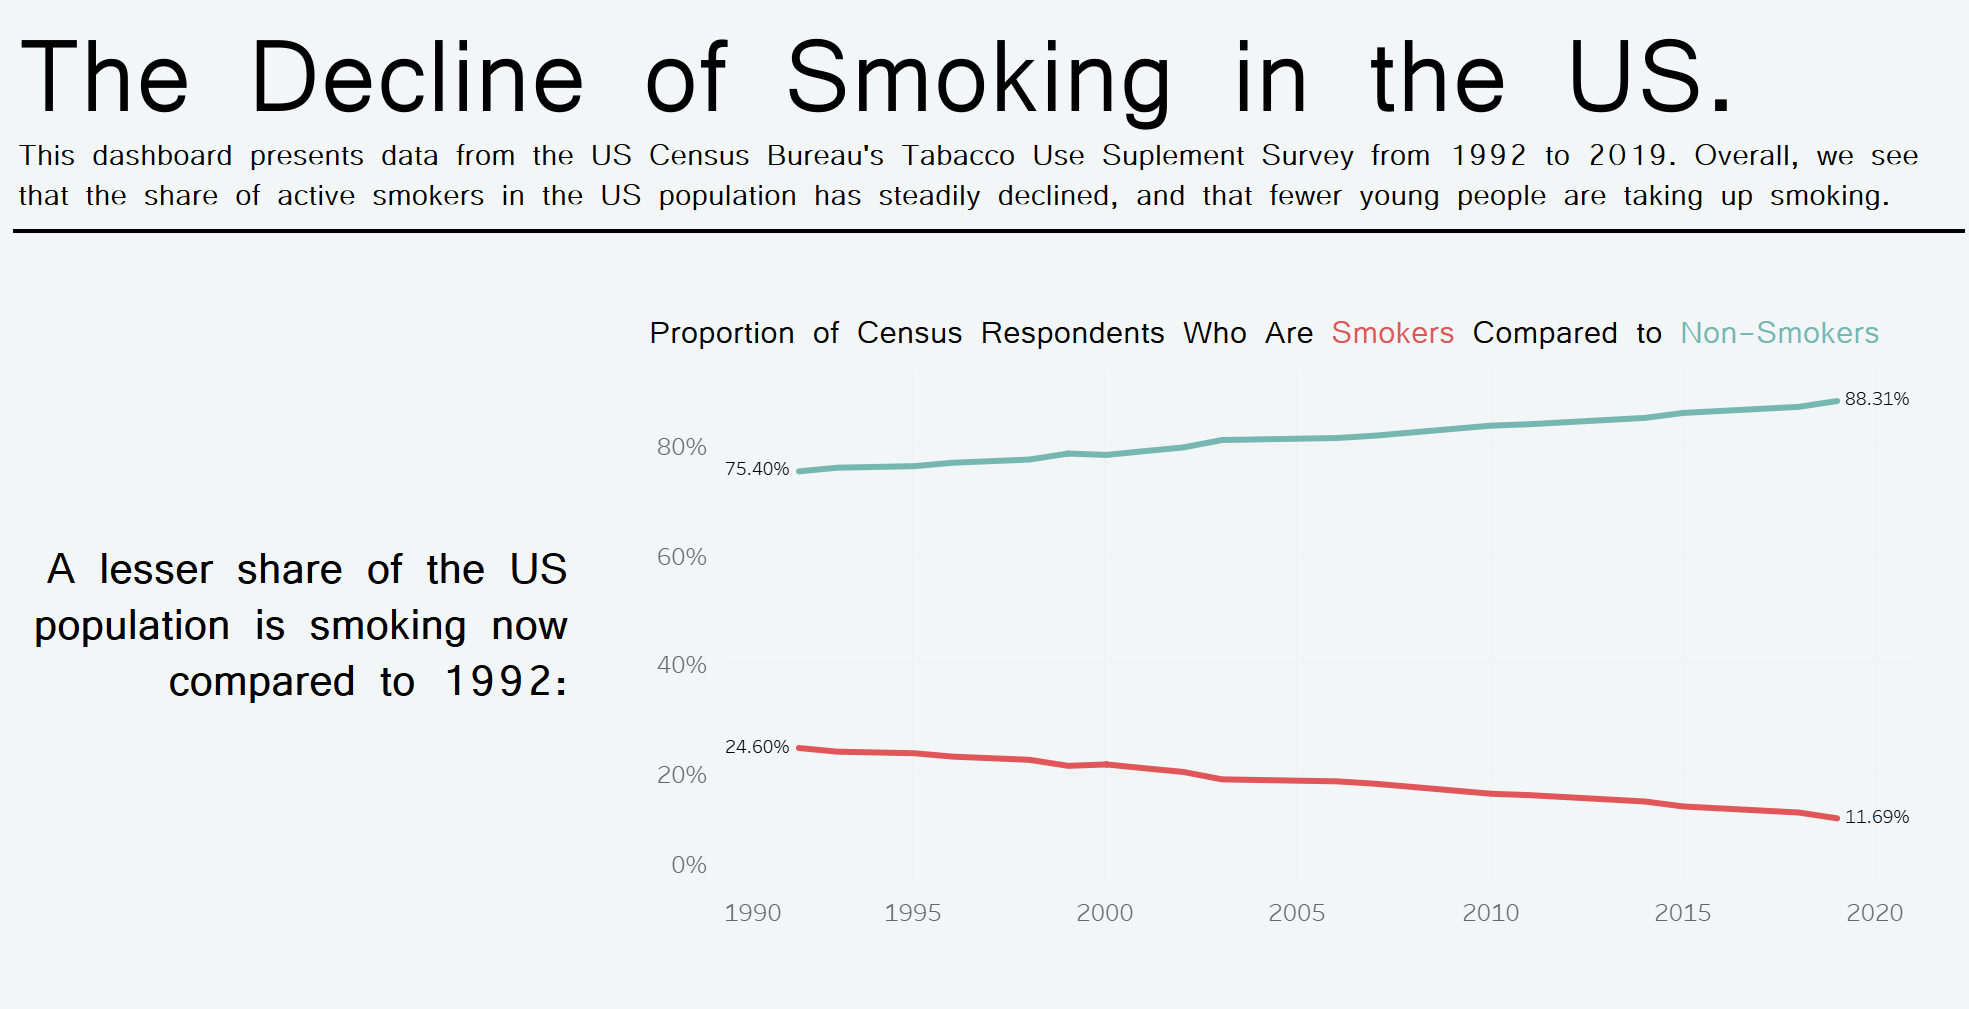
Once in Tableau, I build a number of charts to explore tobacco usage. I wanted to see how this varied over the time span of the data, and in particular how the age of active smokers changed in this time. I found both a steady decline in the proportion of the US population that describe themselves as smokers, and also a steady increase in their average age.