Day 4 of Alteryx 101 week and we have been diving head first into spatial analytics. One of the most useful tools in the set of Spatial tools is the Create Points tool. This tool creates a point-type spatial object field from a longitude and latitude input which can then be used with several other of the spatial tools in Alteryx, as well as output into a Tableau extract file for mapping in Tableau and other applications.

The Create Points Tool
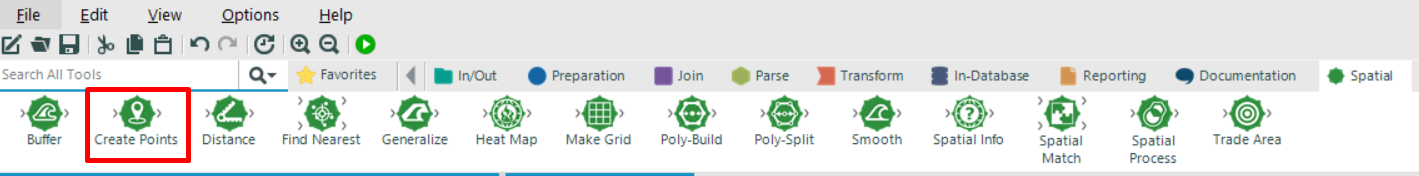
The tool can be found in the spatial tools shelf. It can be dragged into the workflow after a data input which contains longitude and latitude as x and y coordinates. It creates a centroid point which can then be visualised on a map, or output into another application. It can also be used in conjunction with other tools such as the Spatial Match, Distance or Create Trade Area tool.
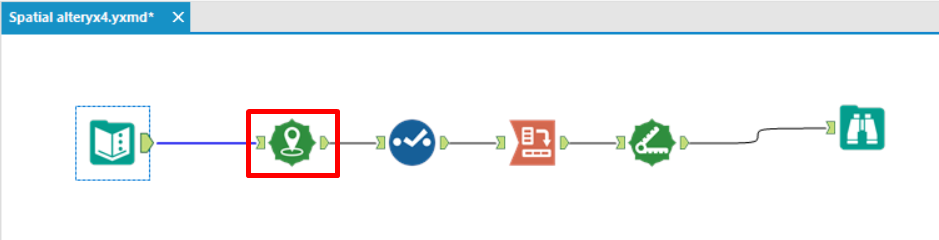
Here we can see a workflow which contains a text input of two sets of longitude and latitude coordinates, in this case the location of the village I grew up in, and the location of The Data School. The Create Points tool sits at the beginning of the workflow, and provides a spatial object point which can then be used further along the workflow in order to perform other calculations. The simple example below shows how to calculate the distance between the village and The Data School.
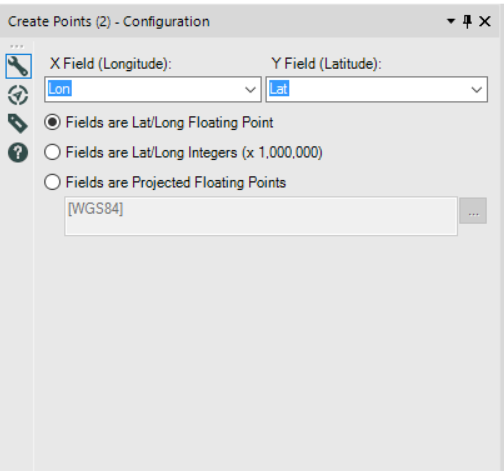
This image below shows the configuration pane associated with the Create Points tool. You can choose the fields which contain the relevant information in the drop-down menus. In this case the longitude (X) and latitude (Y) fields were already named Lon and Lat so are easy to identity. The config pane also allows you to specify what format the longitude and latitude data take – in this case they are floating points due to being in a decimal format. You also have the option to select integers or projected floating points.
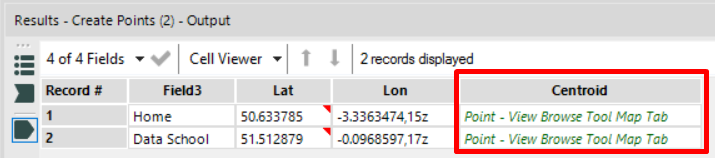
The image below shows the output created by the tool. You can see that the new field is called Centroid and contains green writing. When a Browse tool is added to the end of the workflow the centroid points are displayed on a map. Further tools can be added to the workflow after this point, or an output tool appended to the workflow in order to extract the data into a usable format for software such as Tableau. All in all a very handy tool to have!