Day 3 of Alteryx 101 and today we looked at more prep tools, as well as some parsing and spatial tools. Although a lot of complex ground was covered, some basic tools are still worth taking the time to explain as they can make a huge difference, and allow you to add dimensions to your data which would not be possible without a bit of a headache in other programmes such as Excel.

The Generate Rows Tool
Care to guess what the Generate Rows tool does? That’s correct – it allows you to create new rows of data at the record level. Basically it allows you to create a number of rows incrementally based on an initial expression, and then loop that expression over and over until you reach a point where you want it to stop. In the example outlined below we used the tool to generate a number of rows containing dates. Here’s the workflow, then we’ll look at how the Generate Rows tool fits into the flow.


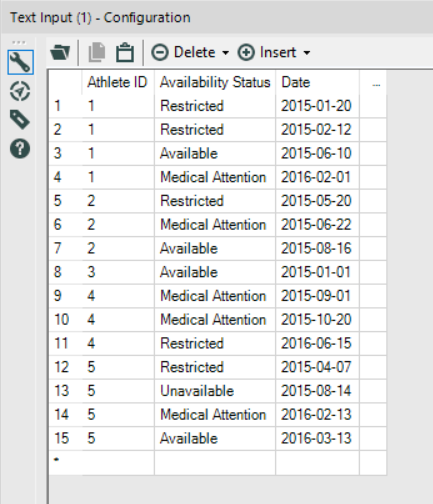
Let’s look at the input first. The data in this example contains just three columns – an Athlete ID, Availability Status and Date. In this instance there was just one date field, which shows a series of dates relating to the status of the athlete. The objective of the exercise was to transform the data into a usable series. You can see that Athlete 1, for example, had the status of ‘Restricted’ on two separate dates, ‘Available’ on another, and ‘Medical Attention’ on another. We know then, that at certain points in time this athlete was either unable to take part in their chosen sport, was under medical supervision or was available to train. Using the Generate Rows tool we can add extra rows of dates which contain an ‘End Date’ – i.e. to quantify all the days between each of the four dates we have data about currently. After adding a new column called ‘End Date’ using a Multi-Row Formula it is possible to add in many extra rows – one for each day. You can read more about how the Multi-Row Formula tool works on Daniel Watt’s blog.
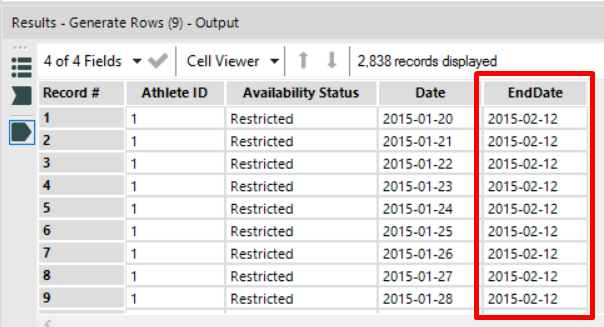
Here is the end result after using the Generate Rows tool:

The ‘EndDate’ column shows a series of rows with the date value 2015-02-12 – this value comes from Row 2 of the original data. In plain English – Athlete no. 1 was given the status ‘Restricted’ on 2015-01-20, and then again on 2015-02-12. The Generate Rows tool allows us to fill in a new row for every single day between 2015-01-20 and 2015-02-12. Each ‘Date’ field increases by an increment of 1 day.
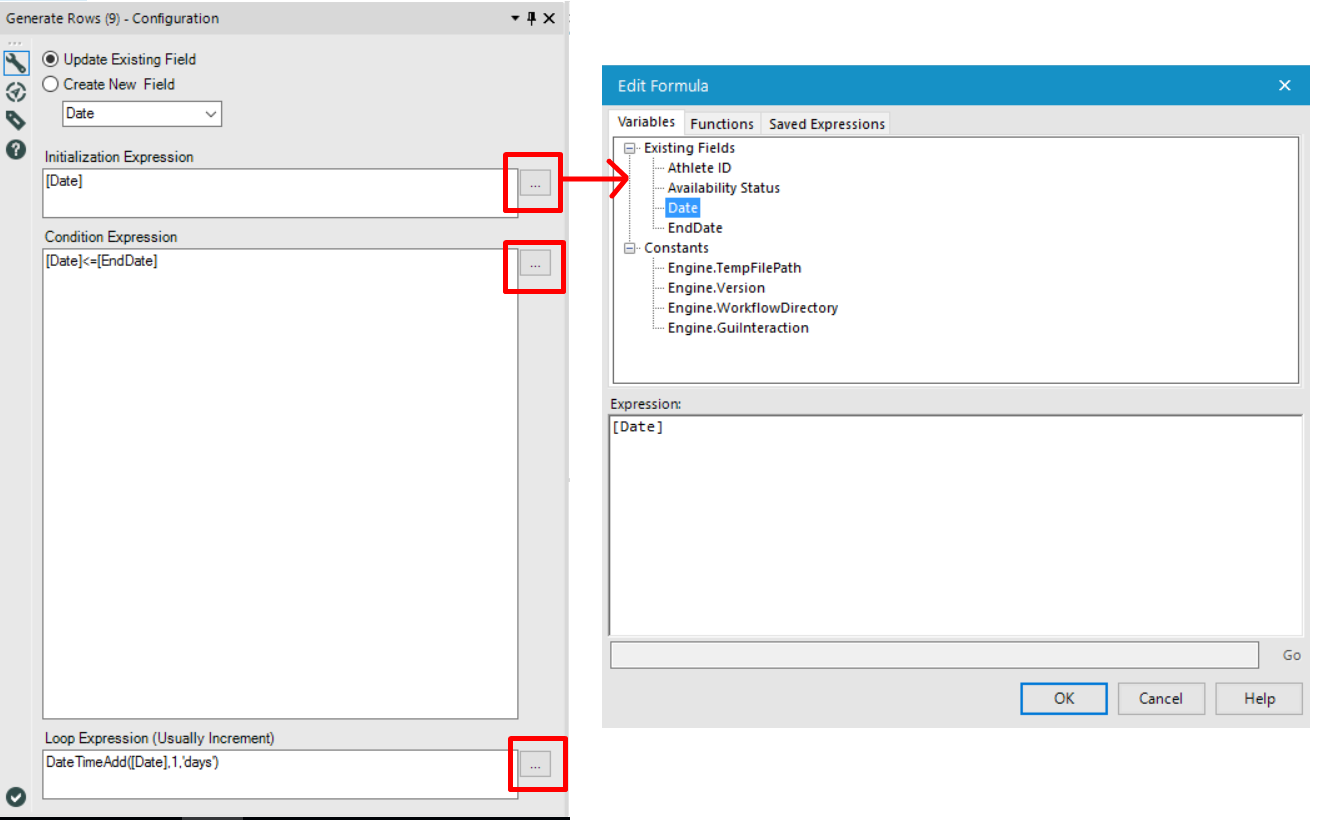
So let’s look at how we got here. We had already used a Multi-Row Formula to create the new column in our data set. Next we configure Generate Rows – since we already have the new column ‘EndDate’ we will choose to update an existing field. Here’s the configuration panel. The ellipsis dots are your friend! They will give you prompts on how to configure the tool.

In our example we are asking the tool to act upon the expression ‘Date’ – hence the field name [Date] is the Initialization Expression box. We are then putting a condition on our instructions – that is that the rows should be populated for as long as the new ‘EndDate’ is less than or equal to our original ‘Date’ – hence the expression is [Date] <= [EndDate]. Then the tool will start again for the next available value in the ‘Date’ field. Hiding down at the bottom of the config pane we put in our Loop Expression. This instructs the tool to add 1 day to every instance of a Date in the Date column. Again, clicking on the ellipsis brings up a handy Edit Formula box with examples to assist you. For DateTimeAdd it gives the explanation “Add a specific interval to a date/time” and then the example formula DateTimeAdd([Date], -3, “days”). The end result is a great way to fill in the gaps in your data where you know you have a number of points in time but do not have enough information to make them into a series.
