


The end of Day 3 at The Data School is upon us already – time seems to fly by when you’re learning Tableau but at the same time it feels so intuitive that already some things feel like second nature after only a couple of days. Today was a crash course in so many different types of viz that I could barely keep count…somewhere between fifteen and twenty. Tableau facilitates a multitude of amazing ways to display and interpret your data, all of which can be tweaked into a seemingly infinite number of iterations. Here’s a small taster of just some of the many, many visualisations which Andy taught us about over the course of the day and then asked us to replicate…
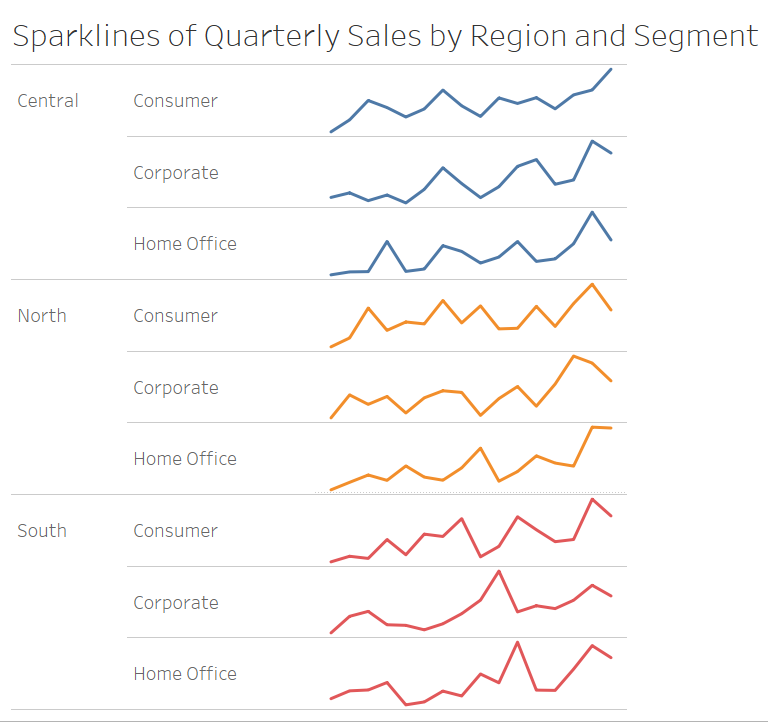
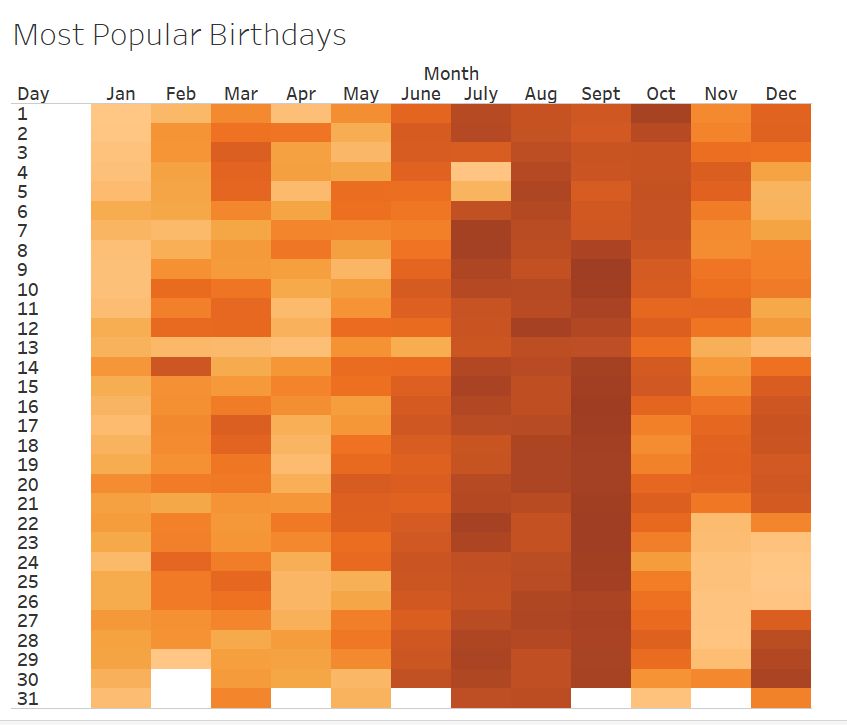
Sparklines and Heatmaps
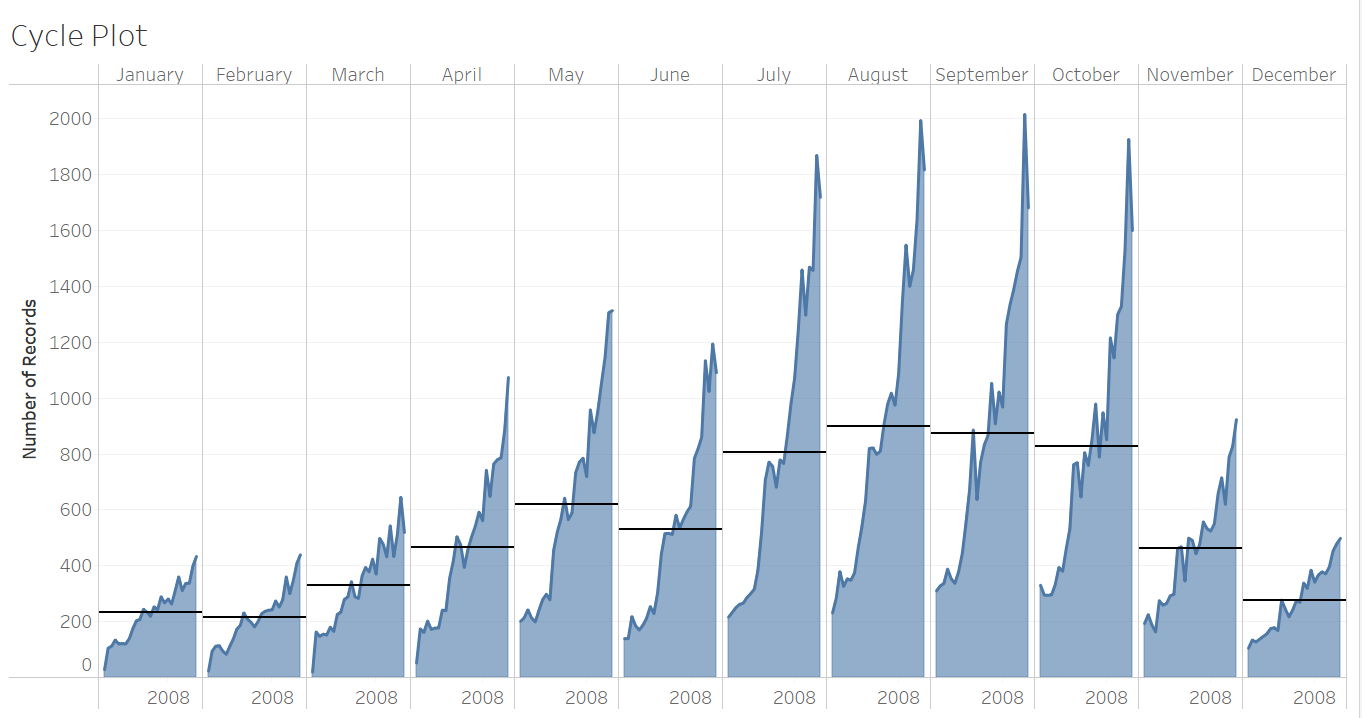
Cycle Plots
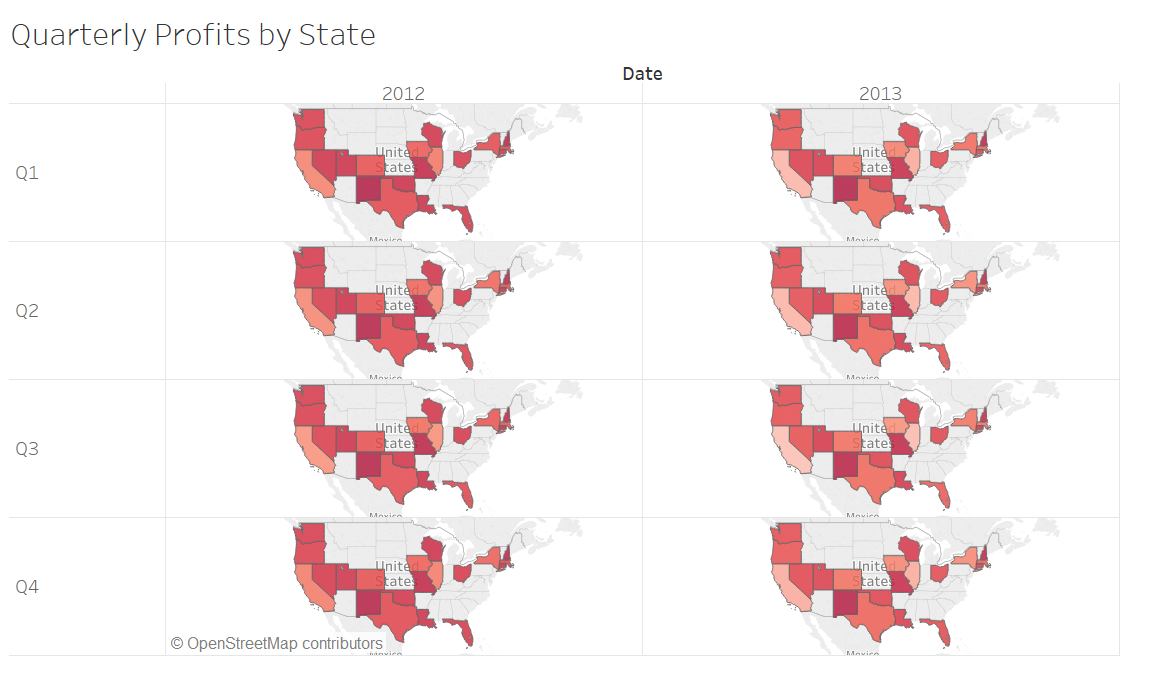
Mapping
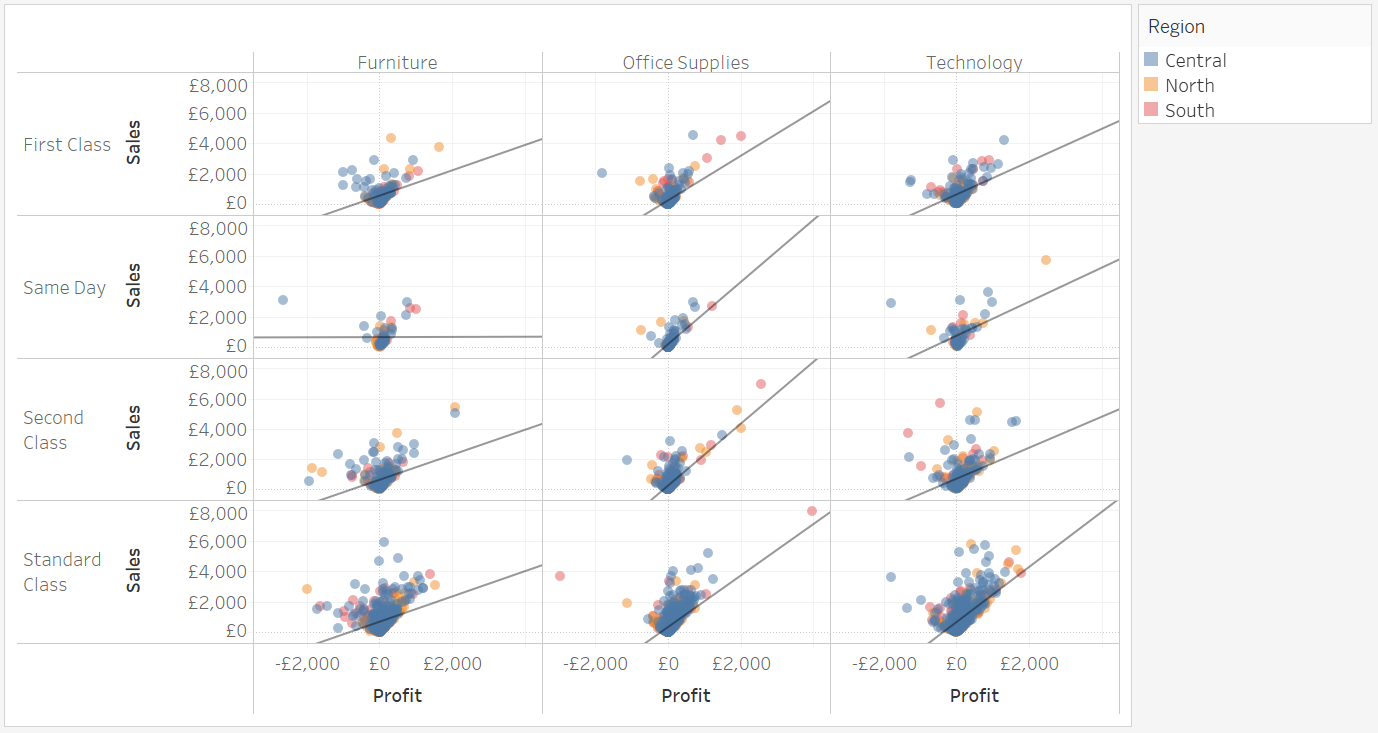
Scatterplots
….not to mention slope lines, calendars, histograms, tables, and both dual and combined axis visualisations. The list seems to go on and on.
My one favourite take away lesson from today has been “If in doubt, right click”. Tableau makes configuring any visualisation pretty straightforward by including most of the options you could possibly need in the right click menu. Want to make a group? Right click. Need to hide a header? Right click. Want to sort your data? Right click. Simple! I know now that whenever I get stuck the first thing I need to do is just right click and see if there is a ready solution available. So whilst today we have been bombarded with a deluge of information, and have probably made upwards of a hundred visualisations already in the last couple of days, it’s really good to know that sometimes the answer is only a short click away.