


I didn’t know what Diamond League was this morning but i’m a little more familiar now. Results are available to view online from all Diamond League meets on their website, nicely packaged up in PDF format. See the below blog from Head Coach, Andy Kriebel.
Our challenge today was to get the data from the PDF, bring it into Alteryx, parse it, clean it and viz it. No easy feat. The overwhelming stumbling block today has been the fact that nearly every table within the PDF document was structured differently. Makes sense as each event s listed and there are different metrics associated with track and field events and the events therein. It was very challenging to ensure data did not appear across several fields.
Particularly, the ‘Results’ of the event, that is, for racing events, the time taken to complete the race. However, there is reaction time to account for and some other numbers associated with results which were very difficult to parse in a reproducible way.
Help on bringing PDFs into Alteryx using R:
Great tip for those who haven’t done much PDF parsing. This is a good starting point to follow your initial step of bringing the data into Alteryx.
REGEX_REPLACE([field],’\s{2,}’,’|’)
This handy equation allows you to handle the spaces, and parse in a largely reproducible way. In plain English, this regex calc takes any sequence of spaces in which there are 2 or more, replaces them with a pipe (|), which then can be used to parse the string field, using a text to columns with “|” as the delimiter. VERY USEFUL in getting started. Thank you Oliver Clark for this great piece of advice.
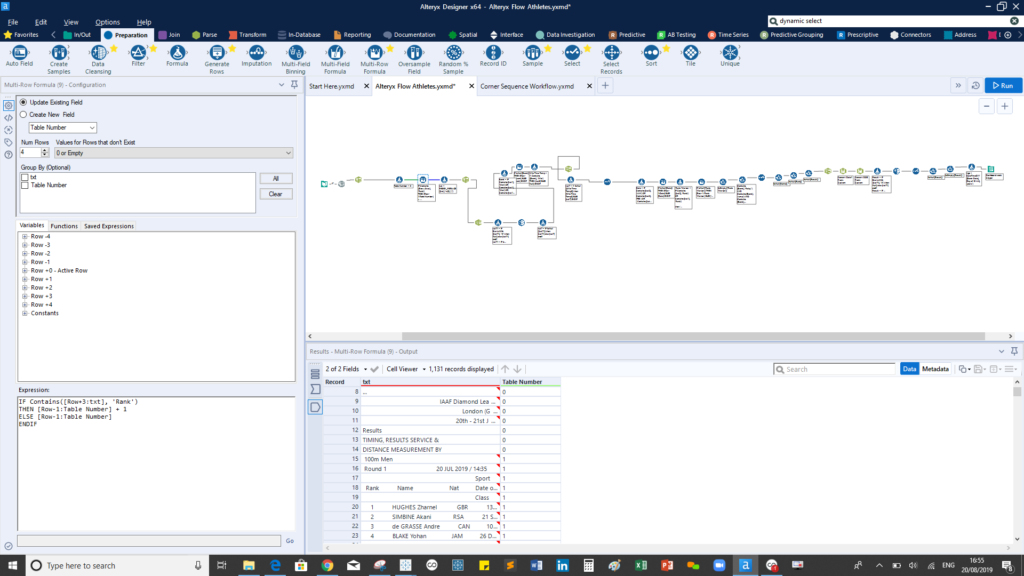
My initial plan was to attach an identifier to each table by finding a repeating unit in the table. The word ‘Rank’ appears at the top left corner of each table. Every event without exception had a ‘Rank’ field. So, in a nutshell: ‘Every time you see rank, increase the table identifier by 1. so every row of data relating to the first table would have a column containing 1, the second 2.. etc
This was easily achievable using multi row formula and formula tools.

The formula above creates a new column of zeros. The multirow formula then reads accross, ‘looking’ for the word ‘Rank’, when it spots it, its adds 1 to the ‘Table Number’ column (making sure the 3 rows above are captured to bring the the event data, in this case, 100m Men).
Ok, so all is well so far, but this methodology broke down later in the flow. My intention now was to break the workflow by bringing each table one a a time in a separate workflow and creating a versatile enough workflow which would resolve them all, probably using a macro of some sort. However, the sheer number of different table structures made this very difficult. I kept getting nulls and duplicates and tool breaking down upon error.
In the end, I abandoned this and just tried to salvage as much data as possible by getting the right metrics in the right columns, ending up with a very non-dynamic, long flow.
Eventually, this viz came out the other end:
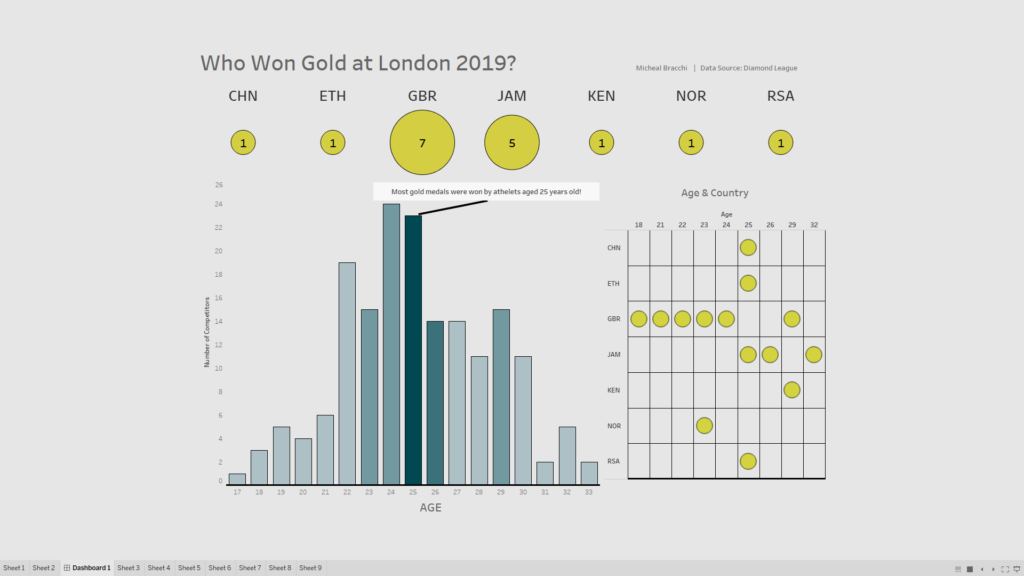
Simply, Who is winning gold?
Lesson Learnt: put more planning into your workflow strategy, and lesson learnt with respect to how difficult parsing PDF can be.