There are plenty of times in Tableau where I have charts that would change due to dashboard interactivity via filter or highlight, and etc. Sometimes it is hard to remember which filter/highlight option I had opted for if my dashboard is quite long and I am way down, and my filter/highlight control is further up. (Yes, I know – first-world problems!)
One thing I would find useful is if the titles of my charts would add in the extra text of the option that I chose to filter/highlight in my title.
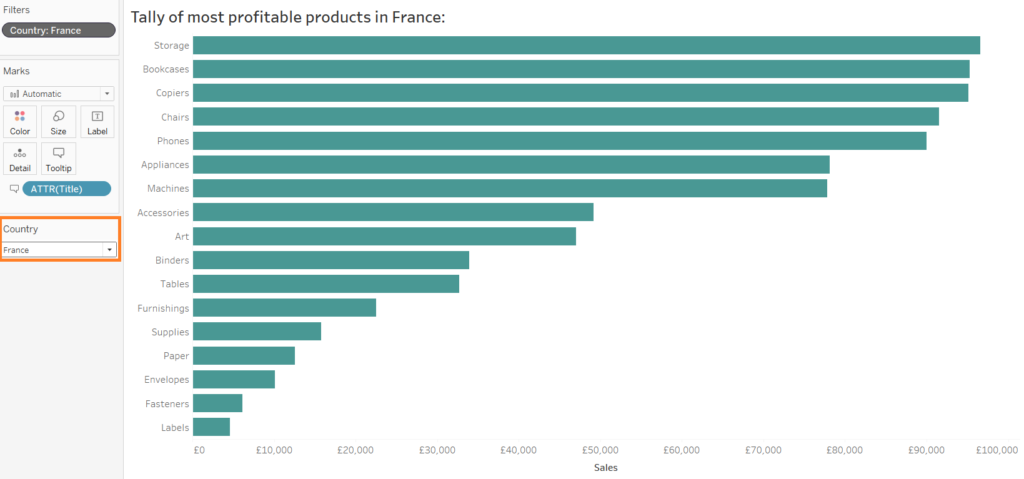
For example, if I had been investigating which City is the most profitable and I filter to Coventry, I would like my chart title to say ‘<Chart Title> in Coventry ‘.
Additionally, I would also like to not show All if my filter/highlight is not filtered to a particular data category.
How to do that?
In this tutorial I will be using the Sample – EU Superstore dataset.
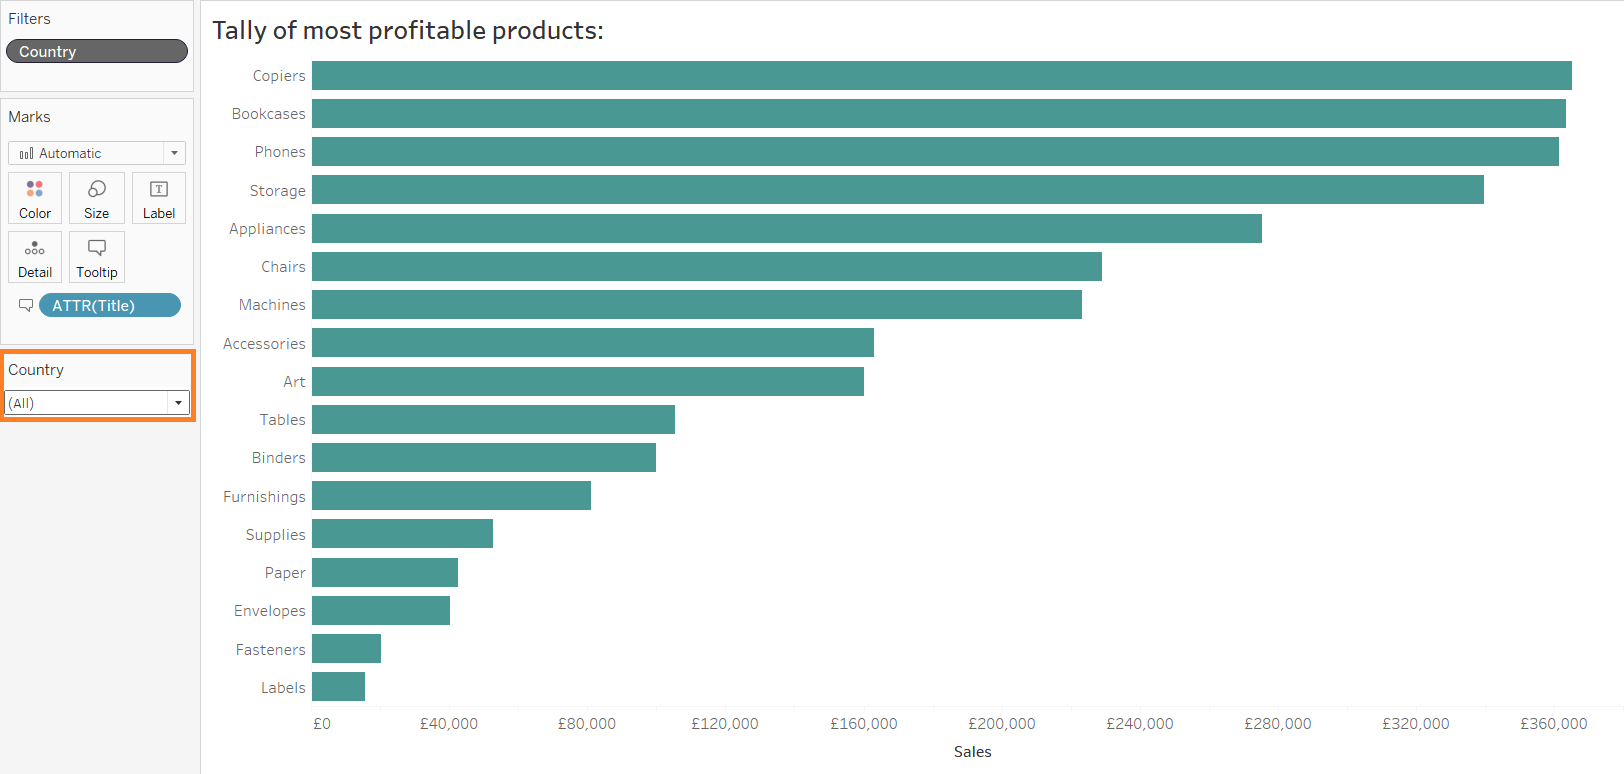
a) I have built a chart that tallies profitable Sub-category products in Europe, see Image 1.

b) Create a calculated field and type in as follows in Image 2.

Image 2: Calculated field created for chart title, includes an Level of Detail expression
The calculation inside of the curly brackets (or braces) {} is a Level of Detail expression.
{FIXED : COUNTD([Country])}
What Tableau is doing with this part of the calculation above is that for everything that is within the view of the worksheet it shall return the Count Distinct value of all the Countries. For those that count to greater than 1, then have a string field of no characters (i.e. ”). This is when the filter/highlight list is set to ‘All ‘.
Or, if the calculation is returning a count of 1 in the view (when we filter for one country in the chart) then return the string value of a space (‘ ‘) and (+) the string of the country ([Country]).
To learn more about Level of Detail expressions, see Sydney’s DS2’s Pris Lam’s blog.
c) Drag the Title calculated field into the Tooltip card in the Marks pane.

d) Edit the chart title and insert the ATTR(Title) field just before the colon as seen in Image 4.

e) Drag the Country field into the filters pane and select Use all. Then add that Country field to context in the Filters pane, as seen in Image 5. Also, check Show Filter.

f) In the filter menu, leave it on All and see how the chart title remains indifferent.

This is expected because our calculated field does not want any text to appear if we have not filtered to one Country.
g) Now, filter to any particular Country and see how the view and chart title changes, as seen in Image 7.

I have posted a similar blog on how to make dynamic tooltips using table calculations and set actions if you’d like to explore more options.
I hope that was useful! Leave a comment if you have any questions about the steps in this technical blog.
