


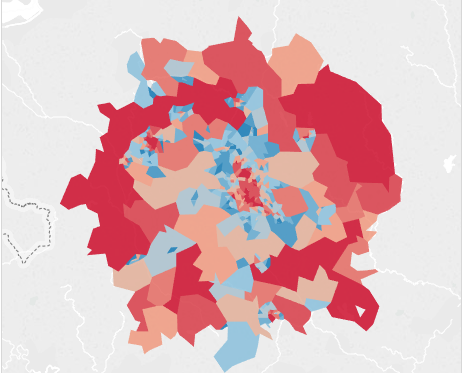
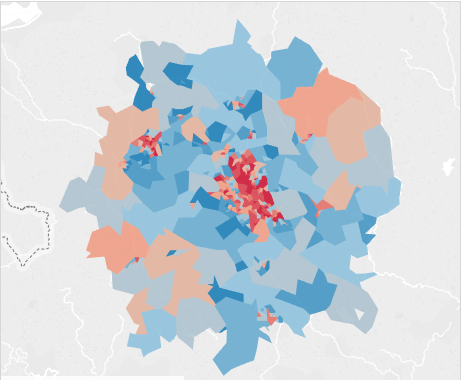
The first parameter I used was in week one when I remade my initial application to the Data School. In the original I had included a map that showed the countries that had taken part in the European Social Survey in 2014 and their average happiness score. However, the dashboard actually also focuses on a second variable, that of attitudes to immigration. I wanted to include the option to switch between these two measures on the map, rather than having to display both at the same time. There are at least two different ways of doing it. One is to create two maps and switch between sheets, following the method that Hashu has previously blogged about. This is what I did for my application reviz in week one. I learned about the second, better, way today for our current project. In this case I want to again let the user decide which variable they would like to see on a given map
You can create a dynamic switch between variable by following these steps:
- Create a map (or other type of chart you want to dynamically switch variables for).
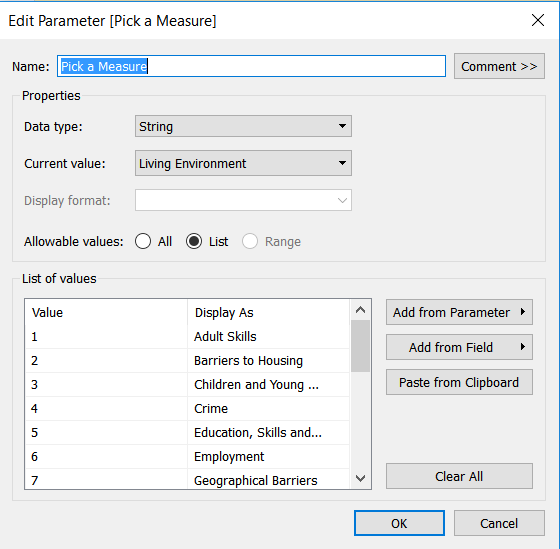
- Create a new parameter and give it a name (in my case “Select variable”).
- The data type is ‘String’.
- Under allowable values I selected ‘List’. This brings up the List of values where you can now enter a ‘Value’ for each variable you want to represent in the final dashboard and a description. I numbered the values from 1 through 16 and entered the names that should be displayed for each in the second column. This has advantages for your calculation, where the value name needs to be entered exactly, so if there are any spelling mistakes the calculation will not recognise your parameter value.
- Create a new calculated field and assign it a name
- This takes the form of an IF statement
- IF [Parameter name] = ‘value’ THEN [variable to be displayed]
- then follow with ELSEIF and repeat for each variable (you can see now why it can be simpler to enter numbers and define them as strings rather than using the complete name if you have lots of variables or complicated value names)
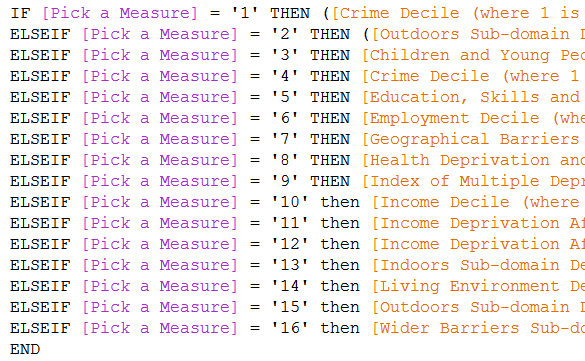
- So if the parameter is set to a value of 2 for instance (which is displayed to the user as “Outdoors”) then the calculation returns the variable for Outdoors Sub-domain
- Drag the calculation to the filters shelf and select only T
- this means that all values that are not True will be filtered from the dataset
- Click on the parameter pill and select ‘Show parameter control’ for this to show up on the sheet
- Drag the new calculation on Colour on your Marks field
When the user now selects a new variable from the parameter selection this will change the colouring of the map. As parameters are valid across a workbook this can be applied to other sheets as well as long as the calculation is used in that sheet.