Emma was in this week to deliver training on LODs and table calculations. I managed to use two new skills in one day and wanted to share these. Will, Borja and I are working on a population pyramid, based on publicly available data. Will describes the first steps of how to make a population pyramid like this in his blog post.
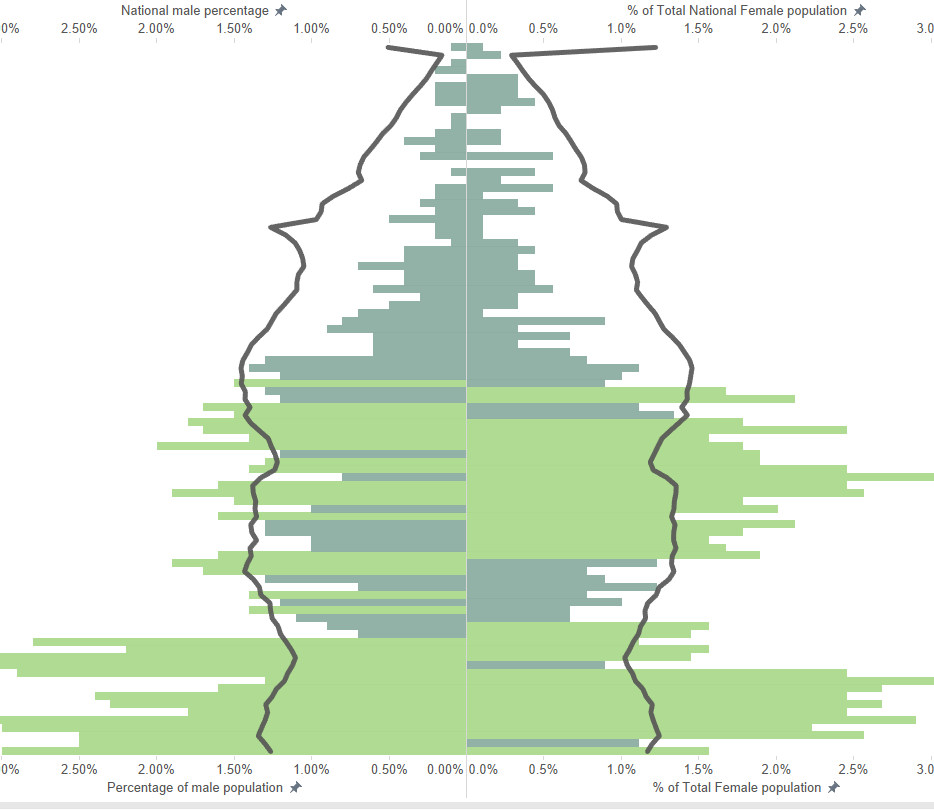
We wanted to be able to show this data for just one area while including a line to compare the values to the average. In order to highlight those age groups above the national average we wanted to include a calculation that would colour these bars differently from those below the average. The preliminary result looks something like this, where the black line represents the national average and all values are given as percentages. With this view you can quickly pick out that this area has an above average percentage of children and people in their 30s.

A population pyramid with a reference line and dynamically coloured bars
Setting the reference line
The black reference line is created by using a dual axis for each gender category and setting the area value to a line, the national to a bar chart. However, as we want to keep the line constant while the bars change we need to include a level of detail calculation, otherwise the line would be filtered as well.
So the calculation for our bars, and thus the variation of population in this particular area is:
IF [Gender] = ‘Female’ THEN [Number of people] END
This is filtered by any given area that is selected.
The line is created with the following calculation:
{ FIXED [Age group] :SUM(IF [Gender] = ‘Female’ THEN [Number of people] END)}
This level of detail calculation fixes the value of females at the age level and thus is not affected by the area filter.
Colouring the bars
In the following step we created the calculation in order to colour the bars according to their value being higher or lower than the national average. The result is a Boolean calculation that will return a true value if the percentage of local females is higher than the percentage of females nationally. However, as we were expressing this in percentages we struggled to figure out the correct syntax for the calculation and went through several iterations without the desired results.
This is where the second lesson of today delivered the solution. After creating a table calculation in the view you can save this by dragging a copy (hold ctrl and drag to desired location) in to the data pane. This will give you a new calculated field that you can now edit and thus see exactly what the underlying syntax is. By investigating our calculated fields in this way we came up with the final calculation for the reference line:
SUM([Female population]) / TOTAL(SUM([Female population])) > SUM([National Female population]) / TOTAL(SUM([National Female population]))
The first part is the percentage of females in the local population, the second the percentage in the national location. This calculation now works and results in a true statement if the percentage of females in an area is higher than that nationally. By dragging this to ‘colour’ on the two marks shelves for the bars (the local level data) these will be coloured by the two categories that have been created (true and false).

