


Today’s Dashboard is about gun deaths in the U.S. between 2012 and 2013, using the dataset from this view from the Huffington Post: “Mapping the dead. Gun Deaths since Sandy Hook”.
Obviously, it is a peculiar dataset to work with, it is sad and gloomy, but really meaningful.
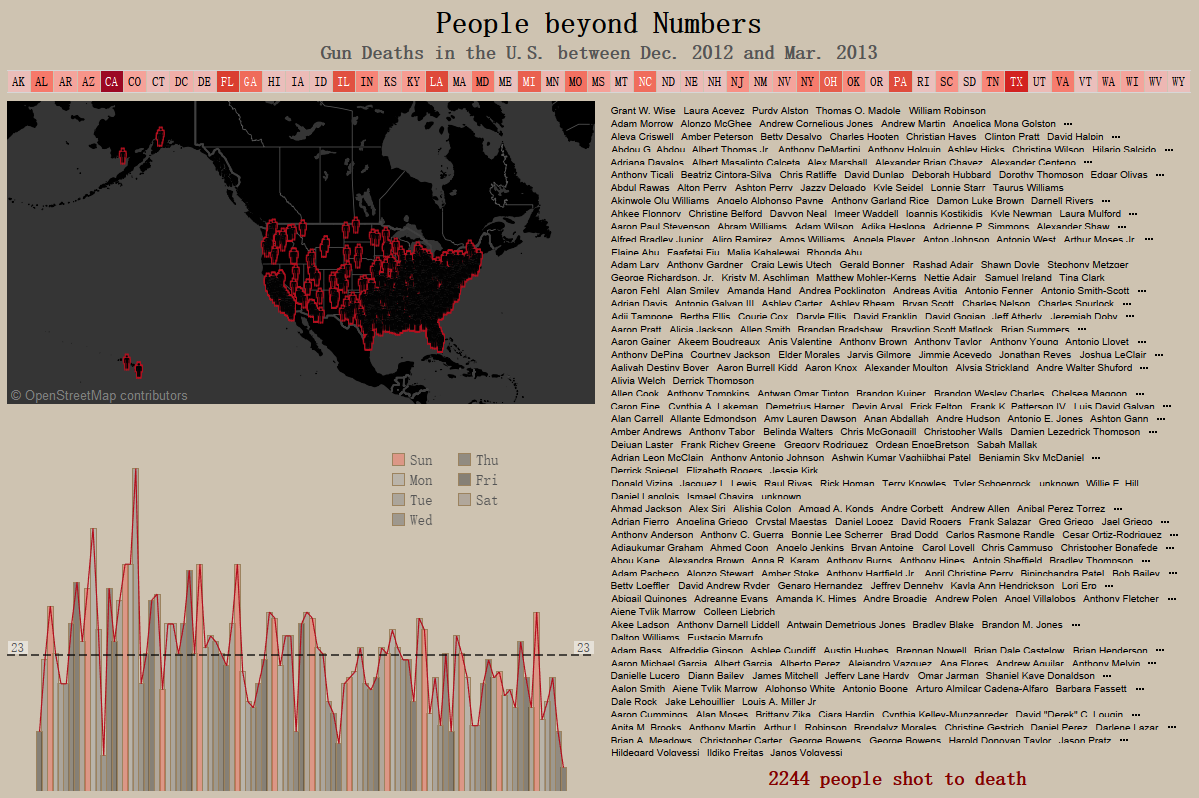
Not a single day between December the 12th of 2012, and March the 22nd of 2013 has passed without a person being shot to death, with an average of 23 people per day.
The deadliest days are the weekends, an the two peaks are the first of the year and Christmas Eve.
In building my Dashboard, I chose to give the greatest importance not to the numbers, but to the people and their names.
Hover over the map, or the States, or the days in the bar chart, to highlight the names of the people who have been shot. You can also filter the view by a single State.
Click on the image to go to the Viz.