


When Craig told us he would have made his dataset on GP prescriptions available to us to analyze it, I freaked out!
It is a 500-million-rows dataset that he scraped out of the internet, containing all the GP prescriptions in England for the last five years.
First: How to work properly with such Big Data? And second: What should I have looked for in it?
One should not just push this ginormous dataset into Tableau, start exploring the data drag-and-dropping dimensions and cross his/her fingers.
I mean, Tableau is powerful, and if you want to you can actually do it.
However, it is not the smartest way to approach the Big Data analysis (especially if your coach gets a record of the performance of all your queries and does a ranking of your team, adding an extra challenge!).
The first thing I did was surfing the internet looking for an interesting angle for approaching the dataset, which I found very quickly in this article from the BBC:
Click on the image to read the full article!
I realized that looking at prescriptions of antidepressants could have possibly led to an interesting story, and therefore I started querying the Exasol database in this direction, using statements from Robin’s SQL lesson.
Exasol (Exaplus) makes writing SQL simple, even if it is your first day using the syntax, as it includes for instance useful templates, and a history of your queries.
Learning SQL was fun because of the feeling of digging at the roots of Tableau, Alteryx and Data Analysis overall. What makes Tableau and Alteryx awesome is exactly the fact that they enable people to make sense out of their data without need of writing any code.
However, if you are a young and overwhelmingly curious data newbie you will eventually want to deep dive under the surface!
Having explored the dataset in Exasol, I decided to use Alteryx to create an extract focused on antidepressants and to blend it with two other datasets I found, adding information about:
– Demographics of GPs and CCGs, in order to weight the prescriptions with the number of patients overall, and make some demographic analysis;
– Index of Multiple Deprivation of GPs and CCGs, in order to explore the correlation between deprivation and prescription of antidepressants.
Below the Alteryx workflow I used:
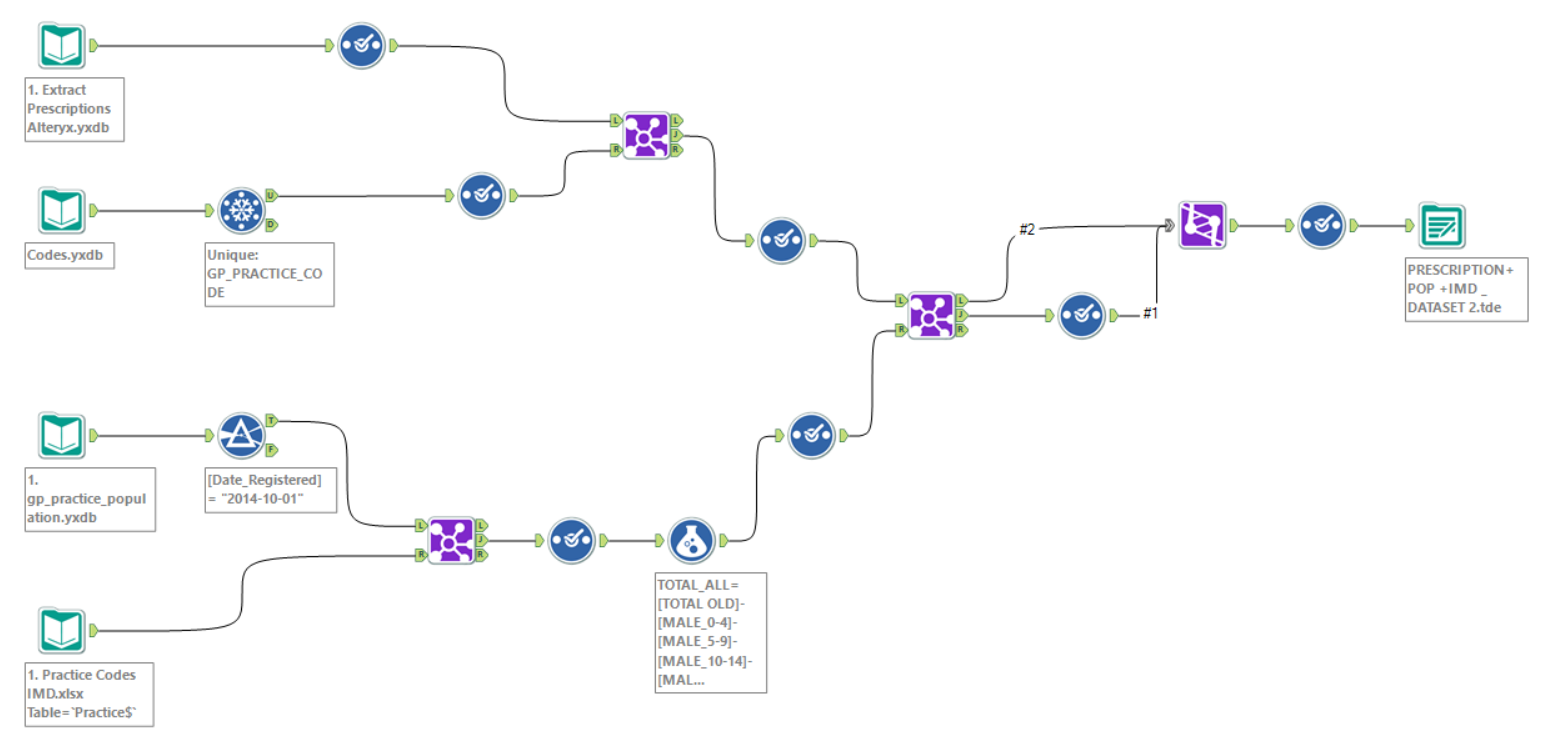
The Alteryx workflow I used to create the extract and join the datasets!
Through this workflow, I was able to blend together the data from the different sources, while still reducing my extract from 500 million rows to just 17 million!
For the final, uploaded version I also had to add a filter for reducing the dimension of my dataset to 10 million rows, the maximum supported by Tableau Public!
You can find the final result clicking on the dashboards below:
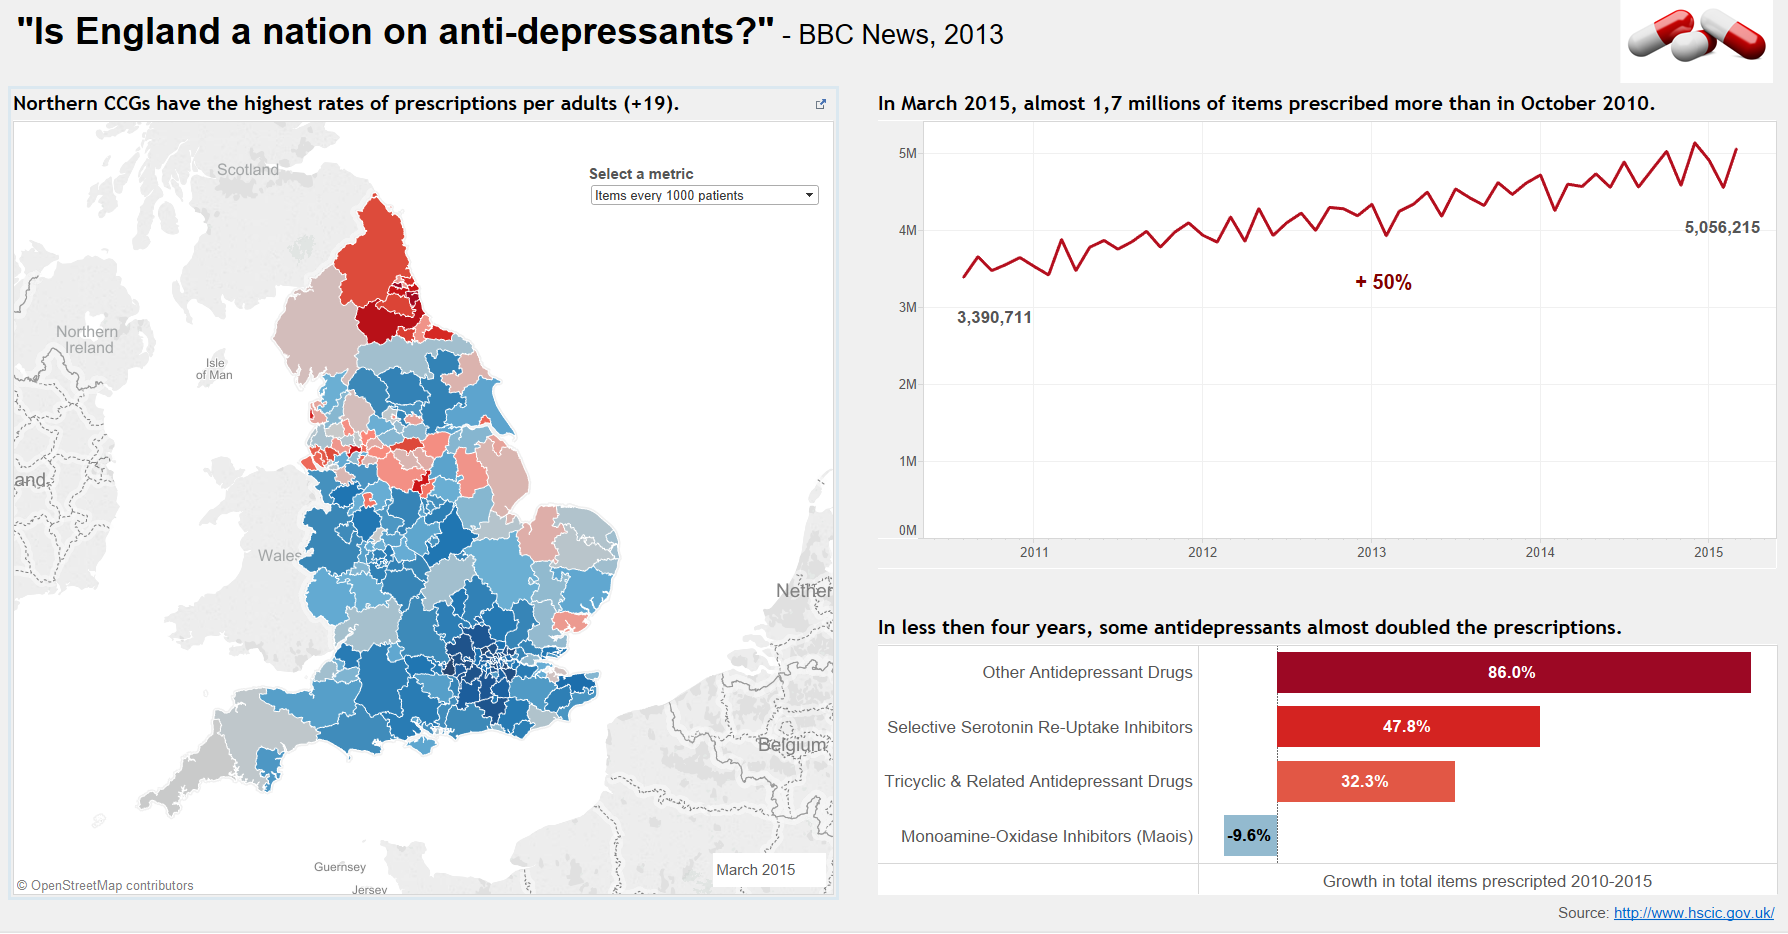
Dashboard #1: Is England a Nation on Antidepressants?
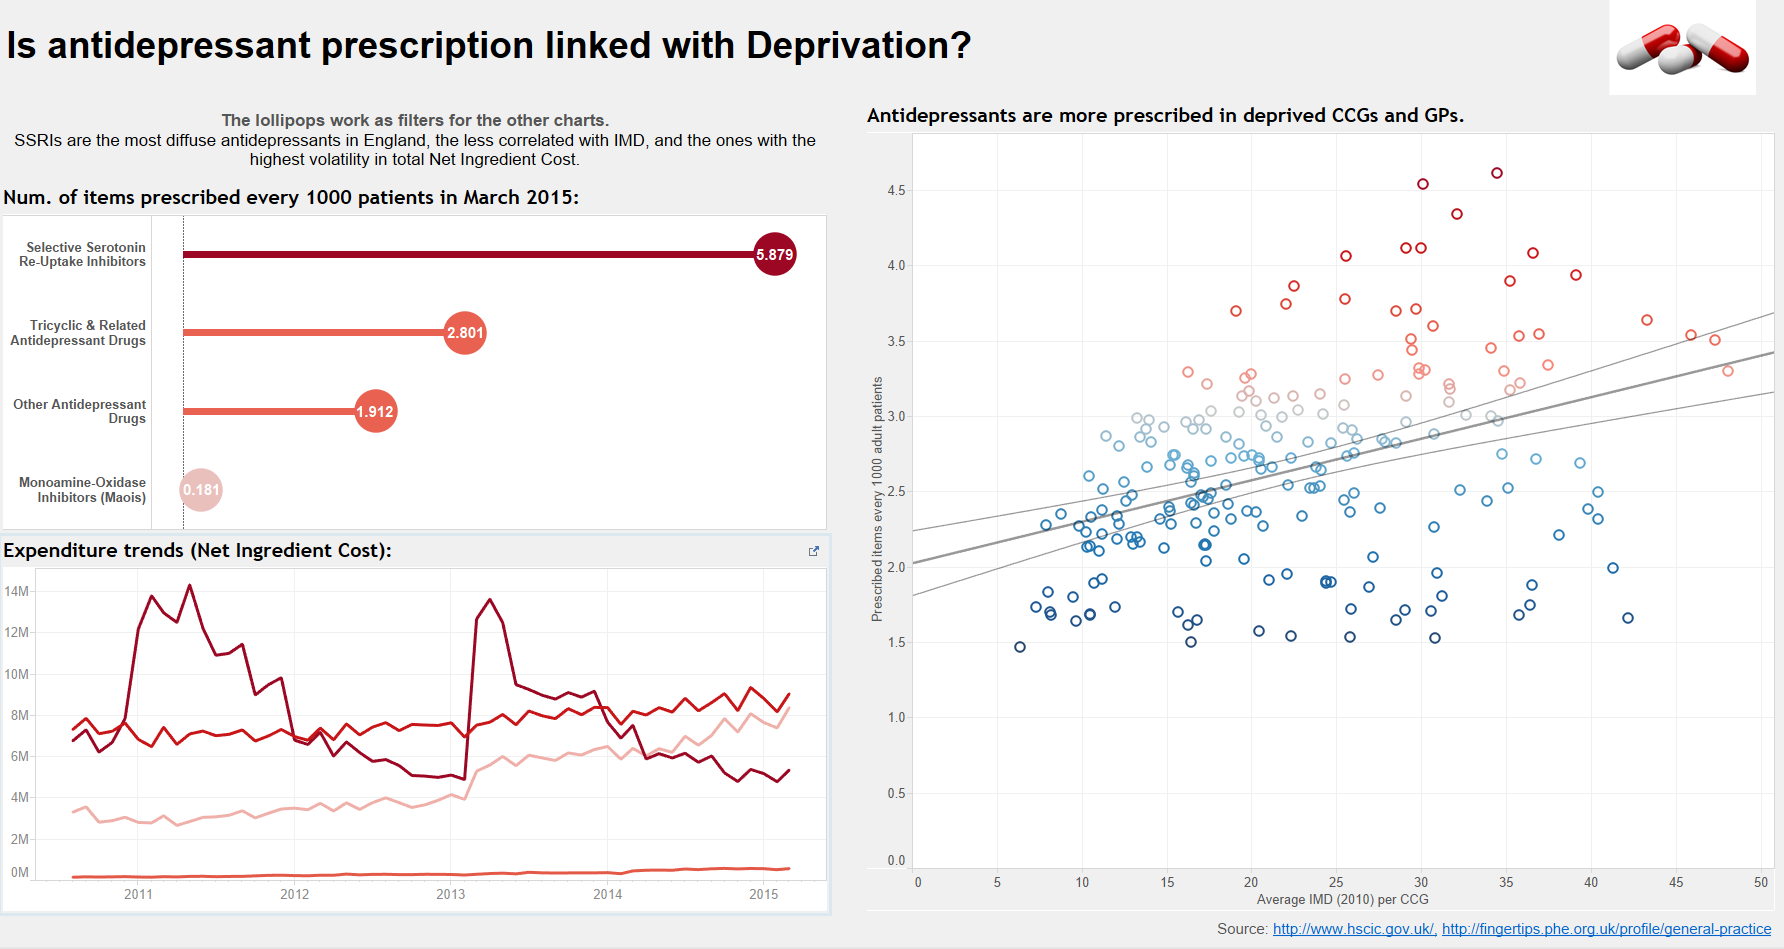
Dashboard #2: Is prescription of Antidepressants linked with Deprivation?
In the end, I focused on the geographic distribution and on the correlation with the IMD, while I did not use demographic data (like age, gender or ethnicity of patients per GP) for the dashboards, even if they are in the dataset ready to go: If you reader want to slice and dice them and see what you can figure out, just download my workbook and give me a shout!