


Before the rush of doing things
I start the day by not really knowing what’s going on…. The tiredness of the Monday morning mixed with being hit with a 253 million dataset that we need to import to Exasol before being able to use it has gotten me a little confused. Jonathan started with downloading the massive file (an hour in and over 6Gb so far) in order to upload it to Drive so we can all use it without overfeeding all of our laptops, Ellie downloaded the file containing the information to link the street codes with their locations and names, and Andrew has taken on the task of creating the skeletal table on Exasol ready for the massive file to be inputted onto.
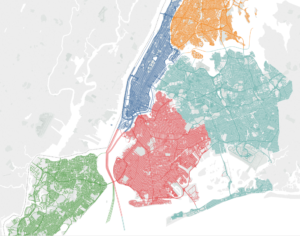
Opening the Geo-Spatial file on Tableau I’ve found very cool as it has the spatial data of each street segment in NYC as a working geometric measure. This gives are really easy to read view of all the streets in NYC and is amazing to be able to zoom in to so easily.
An hour and 40 minutes in and the data file is now at over 10Gb and we still have no idea how close we are to being able to start using the data. In the meantime we are all researching about the topic and seeing if we can come up with ideas of what where we might go with the data, which is quite difficult as we have no idea what the limitations of the data will be.
After over 2 hours of downloading the 11.5Gb CSV file has finally downloaded. Now we try to upload to Exasol, which is giving us a few difficulties. Each time we try to execute the upload we get an error message… We will keep trying!
After completing the dashboard
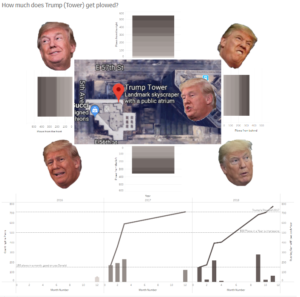
So I’ve finally finished! The day was a stressful one, however whilst I was thinking of ideas I came up with the idea of looking at only the roads surrounding Trump Tower. It would filter amount of roads in the data down from over 100,000 to just 4 and the innuendos of Trump and plowing would be ripe for the taking. Filtering down to just 4 roads ended up being a really good move that reduced a lot of possible headaches.
We had unknown issues with uploading the whole file up to Exasol at once, so we ended up breaking the file into 26 files containing up to 10 million roads and then uploaded to Exasol. This was a work around that solved our issues.
Because of reducing my dataset a huge about and making a very simple dashboard, a lot of my time was spent getting the image of the block with Trump Tower on, finding out which way the tower faces and finding pictures of Donald Trump to supplement my dashboard.
The final dashboard consisted of how many times the roads around Trump tower have been plowed and the plows over time of these roads. Here is the finished result:
So with 1 minute before the deadline of 5pm, I give you this hastily written blog and the ask to not judge me too much for my work…
Link here: