The blog comes to you a few days late, Friday was a blur of a day in which I did not get to write this post. But here it is, the final day of dashboard week, the boys and the bands, a dashboard all about boy bands, their members and accomplishments.
We started the day by presenting our Thursday dashboards about bicycle checkpoints around Seattle. I was particularly proud of this dashboard: Exploring daily bike use in Seattle
We then got into the task for the day, creating a dashboard from two datasets; the boys.csv and the bands.csv downloaded from https://github.com/the-pudding/data/tree/master/boybands
The boys.csv data includes information all about the members of each boy band, details such as eye and hair colour, facial hair and even if they had frosted tips. And the bands.csv data is about the boy band itself, their best song for the American billboard, what position this got to and when it happened. I knew from the start that I was going to focus in on the best boy band of all, Backstreet Boys!
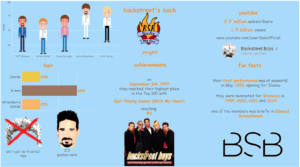
As someone who struggles a bit more with the artistic design side of things, I wanted to challenge myself into making a more fun infographic about the band; forget the maths and logic I am used to, and focus on the artistic way of conveying information. This was a little daunting as it really is not something I have focused on before, but it turned out to be quite fun! We had boy band music playing in our room as we worked, for the inspiration we needed, and set to it. I used the boys.csv data to create a bar chart about their hair colour and a chart based on their height with icons made from the amazing Internet Boy Band Database (https://pudding.cool/2018/11/boy-bands/). I then used information from the data t come up with some static information, such as that they have no frosted tip and a 2:3 goatee ratio. The bands.cvs data gave me information about their best song, which went in as a small amount of text in the middle of the dashboard. Next, I scoured the internet for fun facts about the Backstreet Boys, such as that their first performance was introducing Shamu at Seaworld, which went in as a section of text. And finally I went to their official YouTube channel to find out how many subscribers and views they have got on their channel, this too went in as informatic text, as well as a link to the channel. The dashboard I presented on Friday looked like:

I received feedback as I presented; change the top left chart to something to height on size and get rid of the non-zero start, and to add in links to all of the images that I used. So my challenge today is to make the changes and maybe rearrange the layout to look a little better.
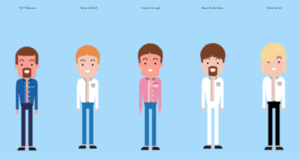
My first challenge has been to change the chart about their height. It was easy enough to take the height from the rows shelf to the size mark so that the icons were sized by the member’s height, but Tableau aligns the centre of the icons rather than bottom, so whilst the icons were different sizes the feet were not aligned so the height difference was difficult to see.

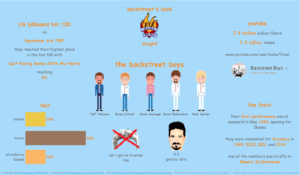
I then used Andy’s blog video on this issue to solve it (http://www.vizwiz.com/2015/08/alignshapes.html), the icon need to be made double the length using blank space so that centre point is at the bottom of the original icon. This gives a much better representation on size for each of the icons, because of this I decided to make the images of the members a focal point of the dashboard so put this sheet to the middle of the dash. I also got rid of the clutter of pictures on the dashboard to make the style more refined. Finally I added a bar at the bottom of the screen with the different links of where the images and icons came from. The version 2 of the dashboard now looks like:

The end product is something I am again quite proud of, it may be a little bit of a silly dashboard but the challenge of making something of a more infographic style dashboard was enjoyable to take on. There are a few tweaks I need to make on it when I find out how to solve certain issues, but you can check out the dashboard here:
