Coach Andy decided to set us the task of using the FOAAS API to get a set of phrases containing some colourful language. First things first with an API – read the documentation. Unfortunately for us, this API lacks any detailed documentation on their site…
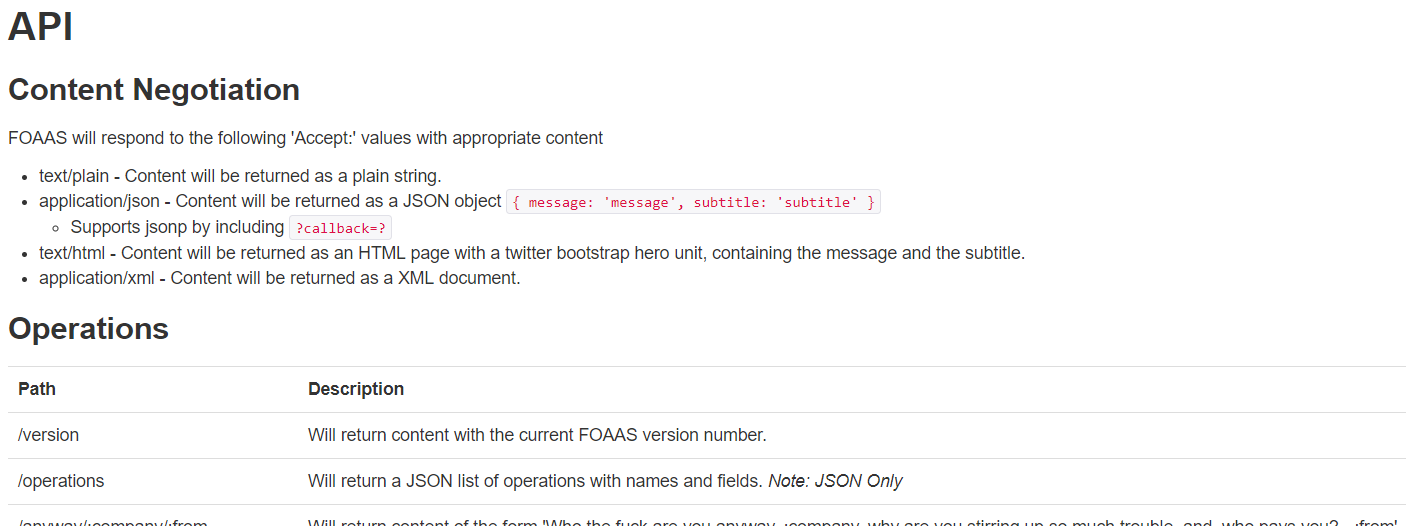
But how do I download as a JSON!?
So, instead of relying on that, it was time to dig in and see what could be pulled out. Luckily, the /operations call returns a list of all the possible phrases in a JSON format.
Using the JSON parse tool in Alteryx, then filtering down to just the returned URLs, I created a new set of URL to call the API for each phrase.
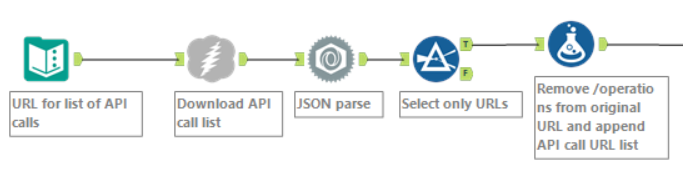
The start of the workflow, including the initial call list download and new URL creation.
The next step was to replace the placeholders in the URL list with words of my choice. By the time I’d reached this point, the frustration was already high enough to warrant adding Andy’s name to the call…
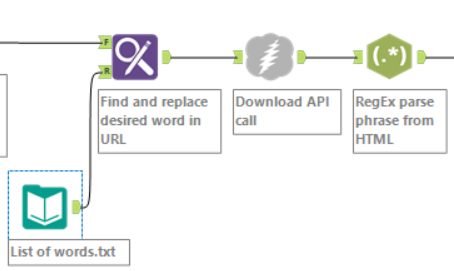
I created a .csv file for the Find & Replace tool to read to update the URLs with Andy’s name, among a few other things.
Next was to download the HTML from the URLs I just created, then split out each phrase using a RegEx parse. After a little more clean up, it was time to move onto getting the data prepared for Tableau.
Phrases
The first part I wanted was the complete phrases, with the only additional change needed being making them “family friendly”.
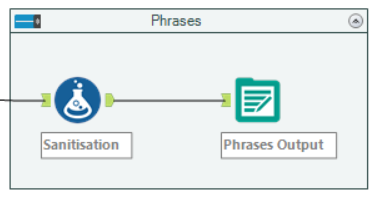
Sanitisation of F-bombs & S-bombs, among others.
Words
Next up, I wanted each word to be separate, so a quick text-to-row, data cleanse & null-value filter later, I had each of the words in a row.
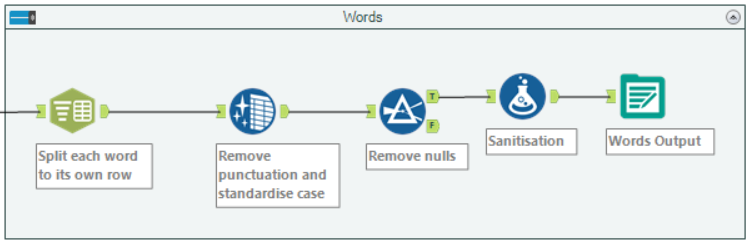
A little more work work than the phrases, but a fairly simple procedure.
Word pairings
Finally, with more than a little help from Louisa, I used the R tool & some fairly simple code to pull out pairs of words from each phrase. This makes the context of the word more meaningful. I also did the same procedure for groups of three words, though didn’t end up carrying that through to the dashboard.
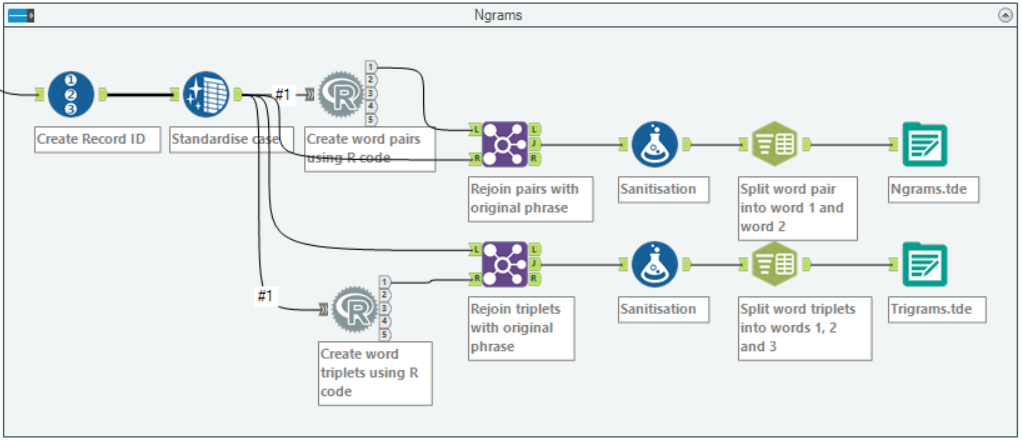
A bit more of a monster, the R tools create pair or triplets of words. Still family friendly too!
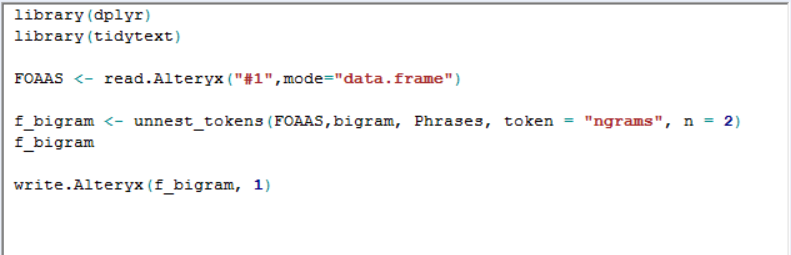
The code used in the R tool to create the word pairs. Tokens = 3 is used in the triplets.
The Dashboard
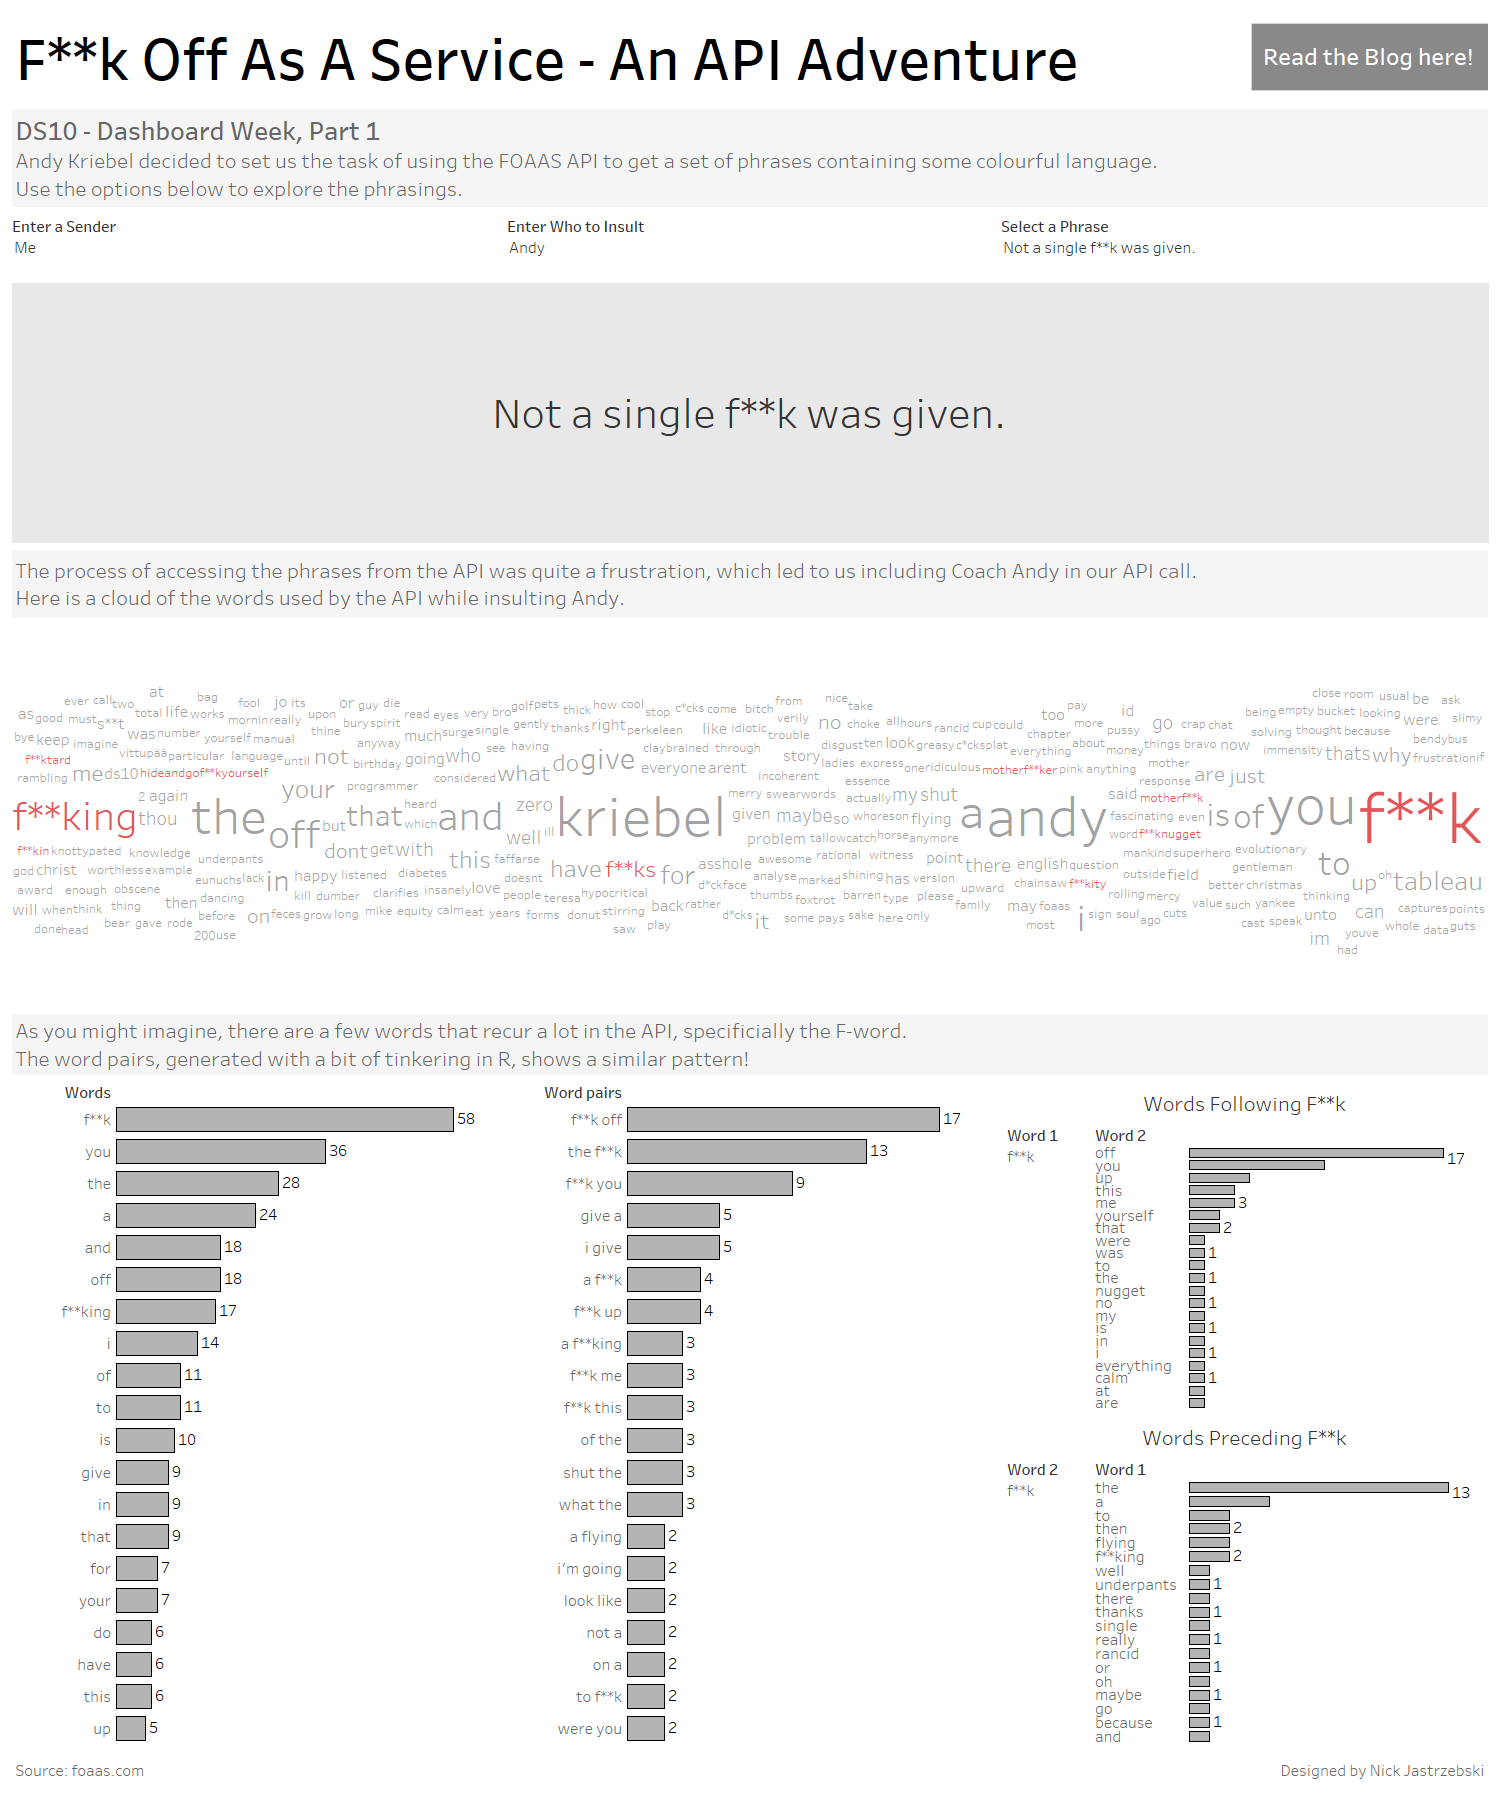
Finally, came the hard part: creating a meaningful visualisation from the API download.
I started by making a set of parameters to allow the user to explore the various profanity-strewn phrases, including some options for customisation.
The user can choose who to insult, and pick their favourite phrase!
Since I had my list of individual words, I visualised them in a word cloud, highlighting the very common words containing ‘f**k’.
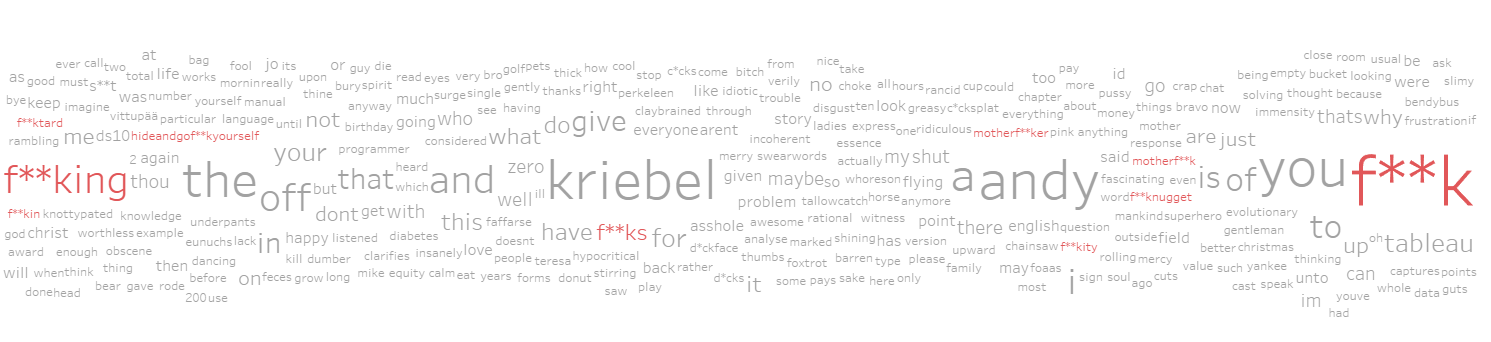
Turns out, the API uses the addressee’s name a lot, as well as f**k.
Finally, since I’m supposed to be an actual analyst, I looked at which words were the most frequently used, as well as which pairs appear most often.
Diving a little deeper into the top work, ‘f**k’, I looked at which words most often followed it and preceded it.
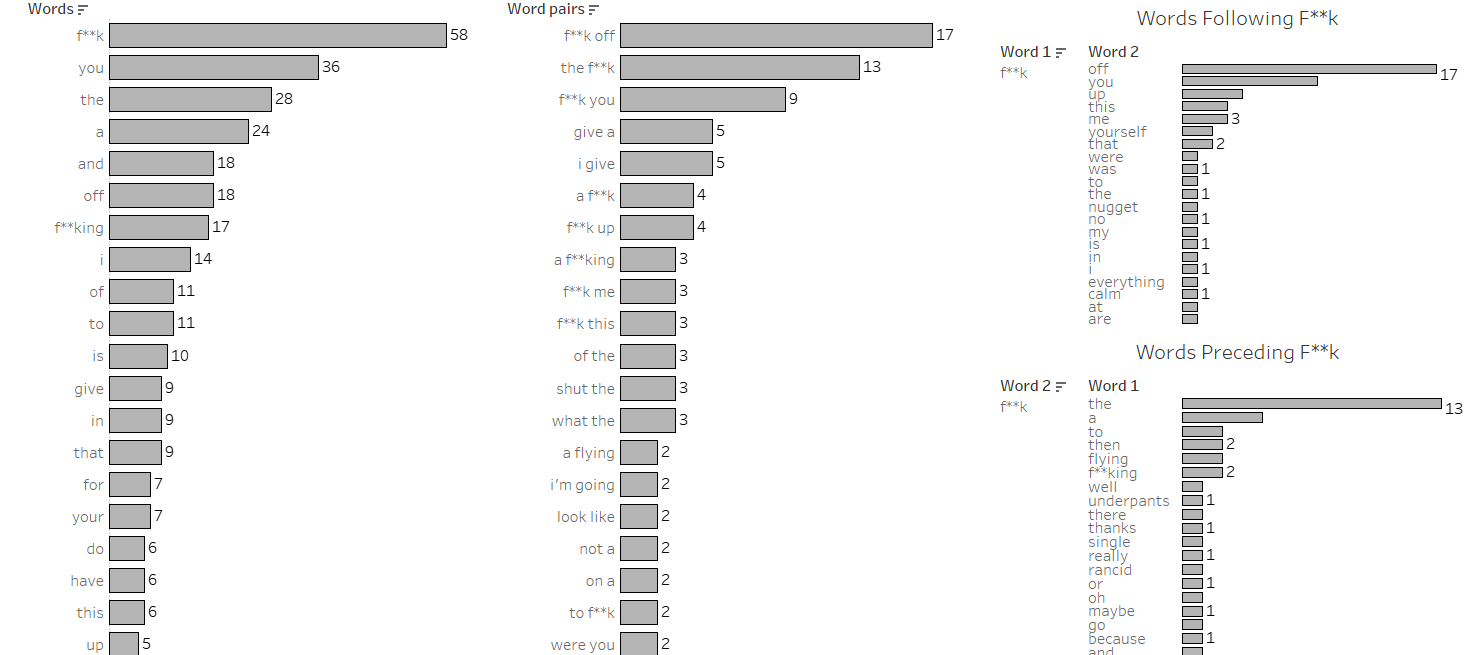
Everyone’s favourite chart type, the bar chart!
I found this task quite challenging thanks to the lack of API documentation and general type of data on there. Visualising word-relation data is notoriously difficult due to the subjective nature of interpreting words and phrases, which doesn’t lend itself very well to this kind of analytics.
However, it was quite entertaining working on the API since it clearly doesn’t take itself seriously, and I’m fairly happy with what I managed to make in a short space of time.
Now on to Tuesday, with even less time to make something!
Click the image below to go the the interactive viz.