The challenge for day 4 (after a great talk from James Eiloart, Senior VP of Tableau in Europe, Middle-East and Africa) – build an analytic app in Alteryx to pull data from the COORD bike share API.
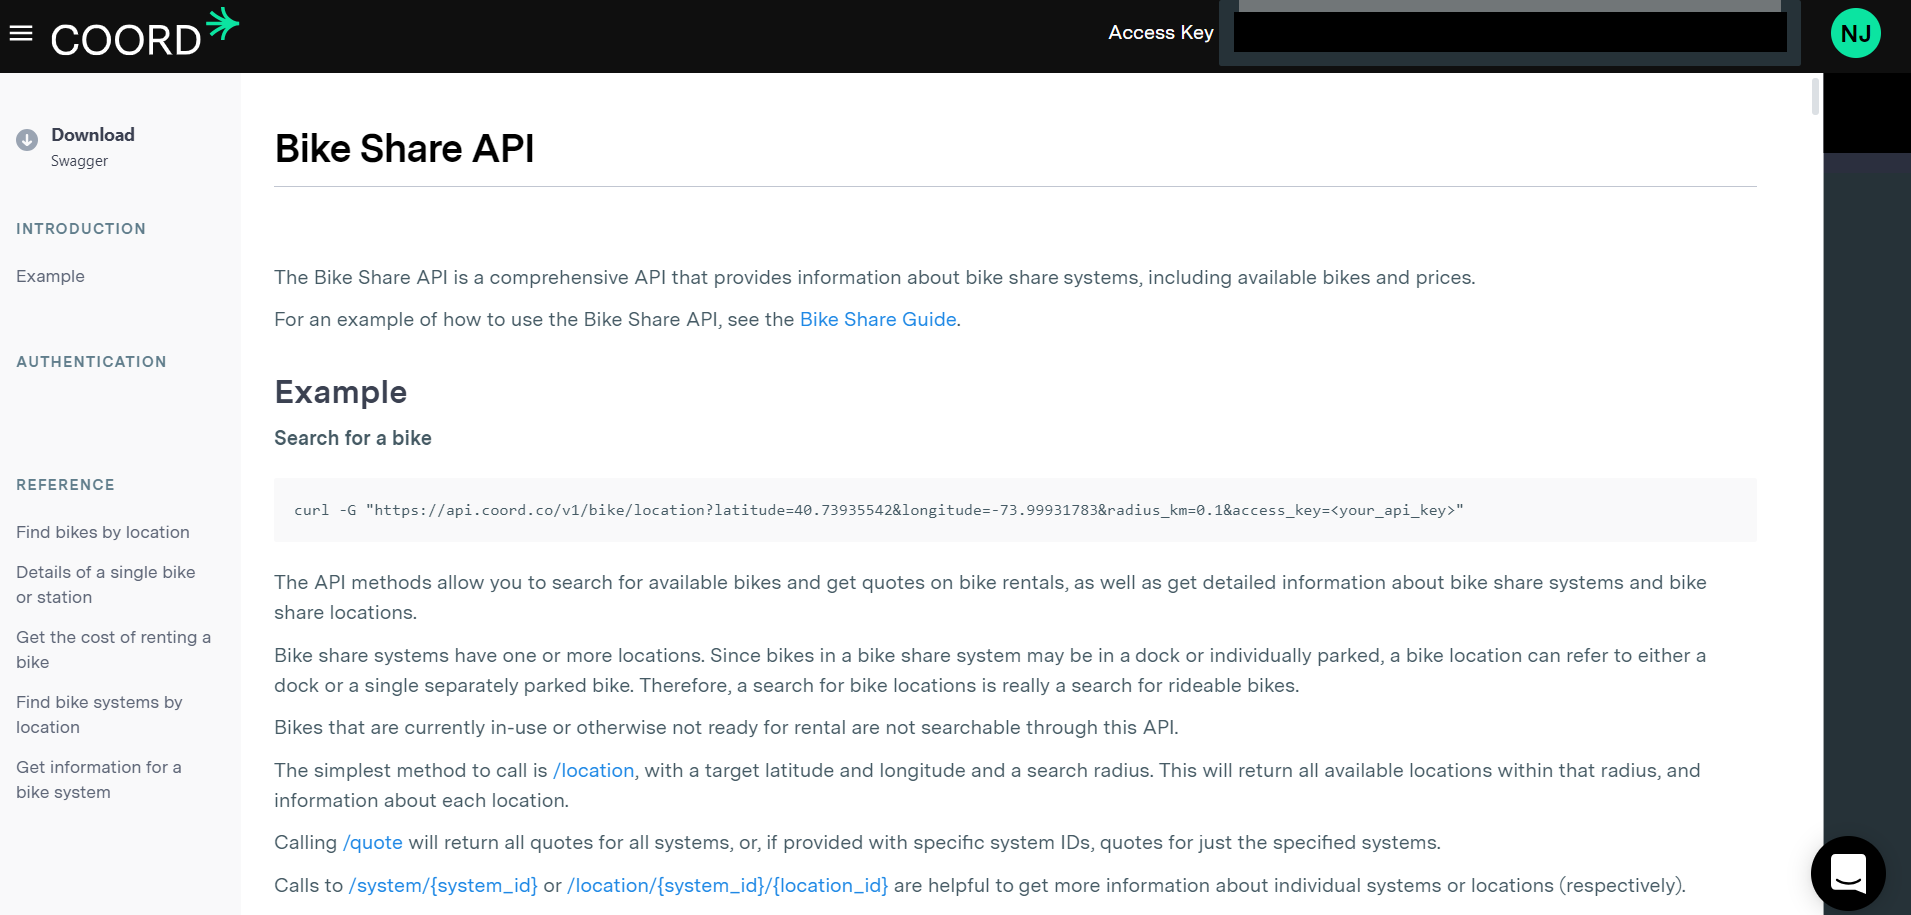
The COORD Bike Share API
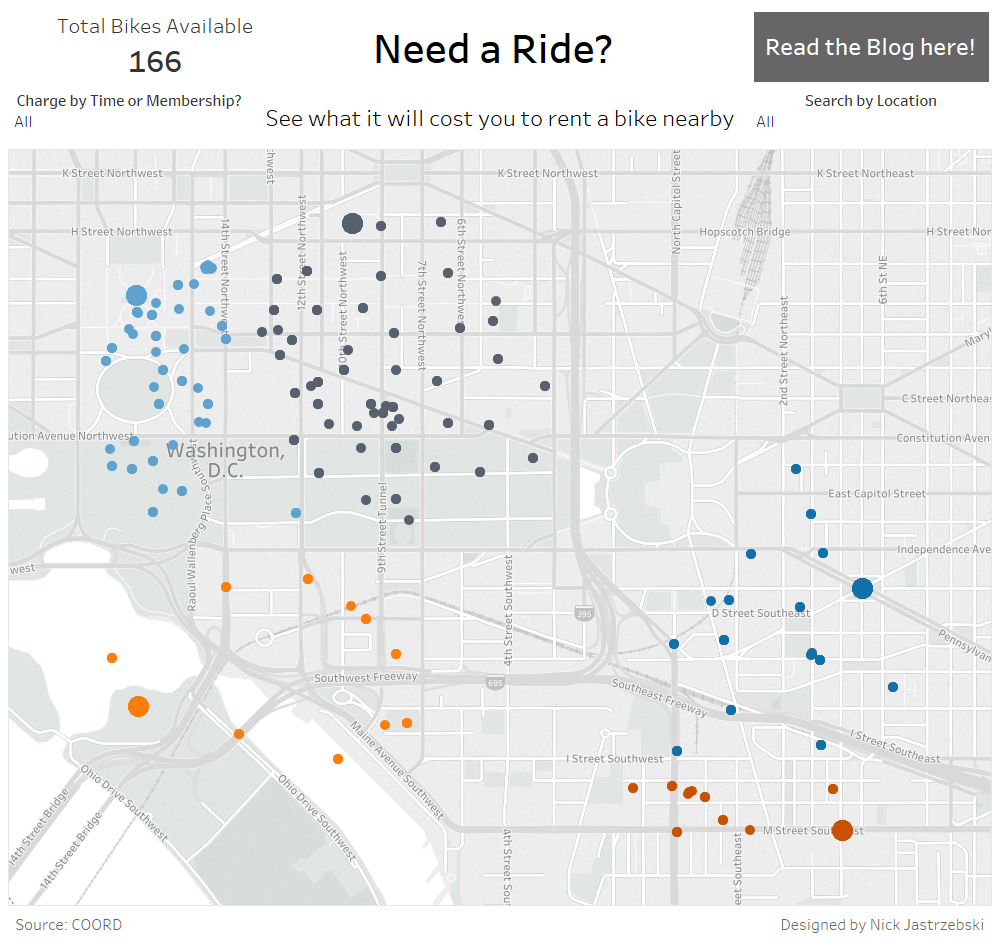
The idea is to allow the user to select a city of interest, five possible locations in that city and a radius around those points. The app will then find all the available bikes within the search area and generate a map in Tableau to show them and how you can pay for them.
We were told to work together to build the app, then each of us would create our own dashboard off the back of that. We split the build for the app into two main segments – finding a way to generate and import latitude and longitude of user-requested searches and then using those coordinates to all the COORD API to find which bikes are nearby.
I was went to work on the second half along with Louisa, Ellen & Gheorghie.
We quickly found there were two main calls that could be made to the API:
- Location – returns the whereabouts of each bike or dock within the given search area.
- Quote – returns information on pricing rate for the various bike share systems in the area.
We found that the quote call didn’t quite work without specifying which systems to return, so we shuffled the workflow around to include the list of systems returned by the locations call.
We had more than a few difficulties in making this work well together, but I persevered and got there in the end!
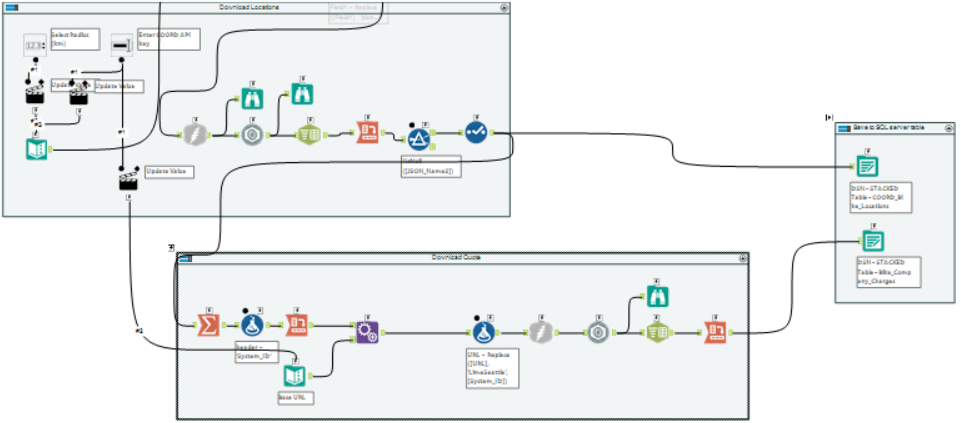
The workflow to call the API for bike locations and pricing data.
Team Teal+ (Conrad, Kirsty and Lily) worked on getting the latitude and longitude, which they delved into the Google Maps Places API for. They took five possible search terms and generated calls for the API to process, returning a latitude and longitude of a place that matched the search terms.
Included in that was also the city name, which we included from the list of cities provided on the COORD website, to make sure the Places API found the right places.
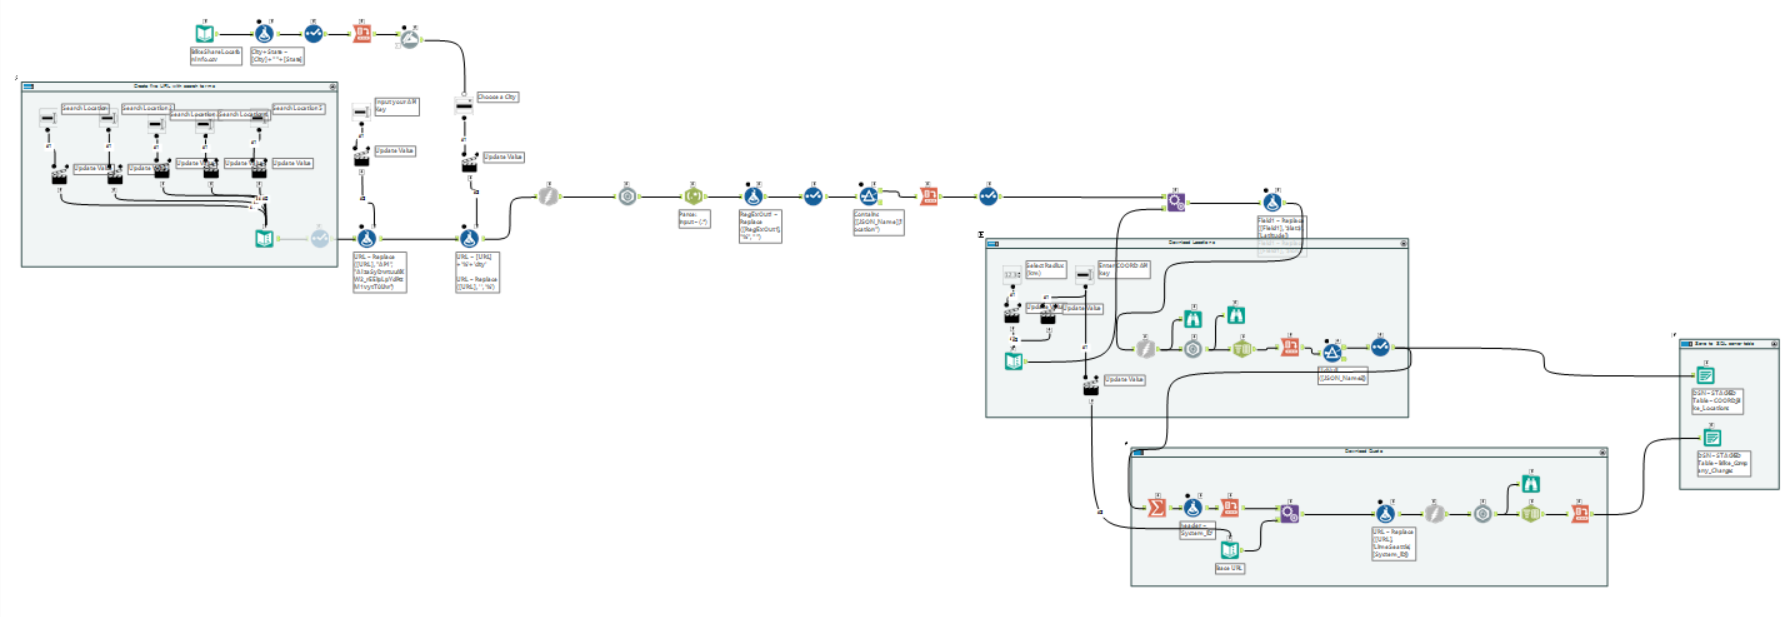
It’s not your eyes, it’s just very zoomed out.
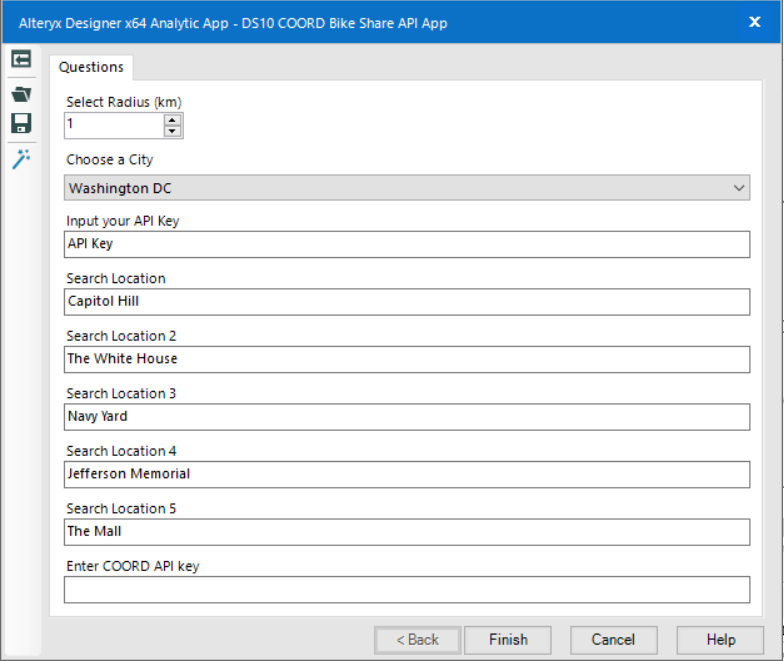
The user interface isn’t the prettiest, but it has all the options to customise the resulting dashboard.
Not content with just building the app, I wanted to be able to integrate it into Tableau so that the search criteria can be updated on the fly.
To that end, I added an output to create a new data table on our SQL server which I could use as a live connection to the data source in Tableau. This means that once the workflow has been run, it will automatically update the dashboard.
However, that still requires the app to be run. So, to make it even easier, I uploaded the app onto our Alteryx server where the app can be run without the Designer interface.
The final touch to integrate this into Tableau is to include an embedded URL to the App within the dashboard. This allows the user to run the app on our server through the web, which updates the dashboard they’re already viewing!
At least, that was the plan. But…
I couldn’t log into the server in the embedded page!
I’ve drafted in our best guys to help get it working, so hopefully I can update with a success story soon. In the meantime, enjoy this dashboard I whipped up at about 6pm!