Today was another sports data set today. After having already analysed the London Prudential Race cycling data, we changed sports and dived deep into the world of baseball. Retrosheets has data about the MLB available going so far back as of 1871.
The data is available as .txt. files. Each text file contains information per year about the players, winning teams, etc. To load in all the text file, we created the following workflow:
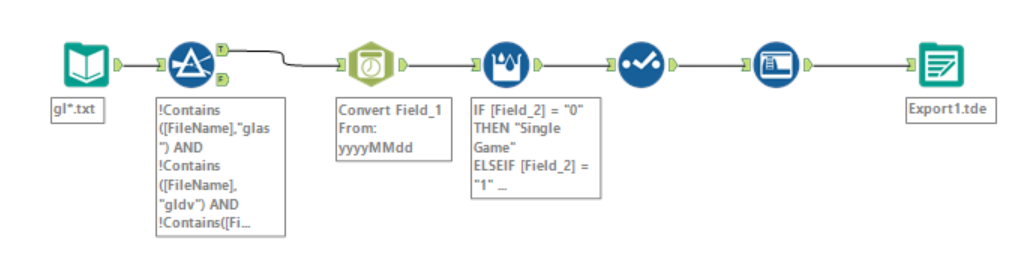
The input tool with the wildcard * inputs all text file regardless of the data. The filter tool filters out some text files which fit the condition of the wildcard but we do not want to have included in our analysis. Afterwards, the Date Time tool converts the data columns which priory was in a string format into an actual date data type. The multi-row formula separates the data into different columns categories.
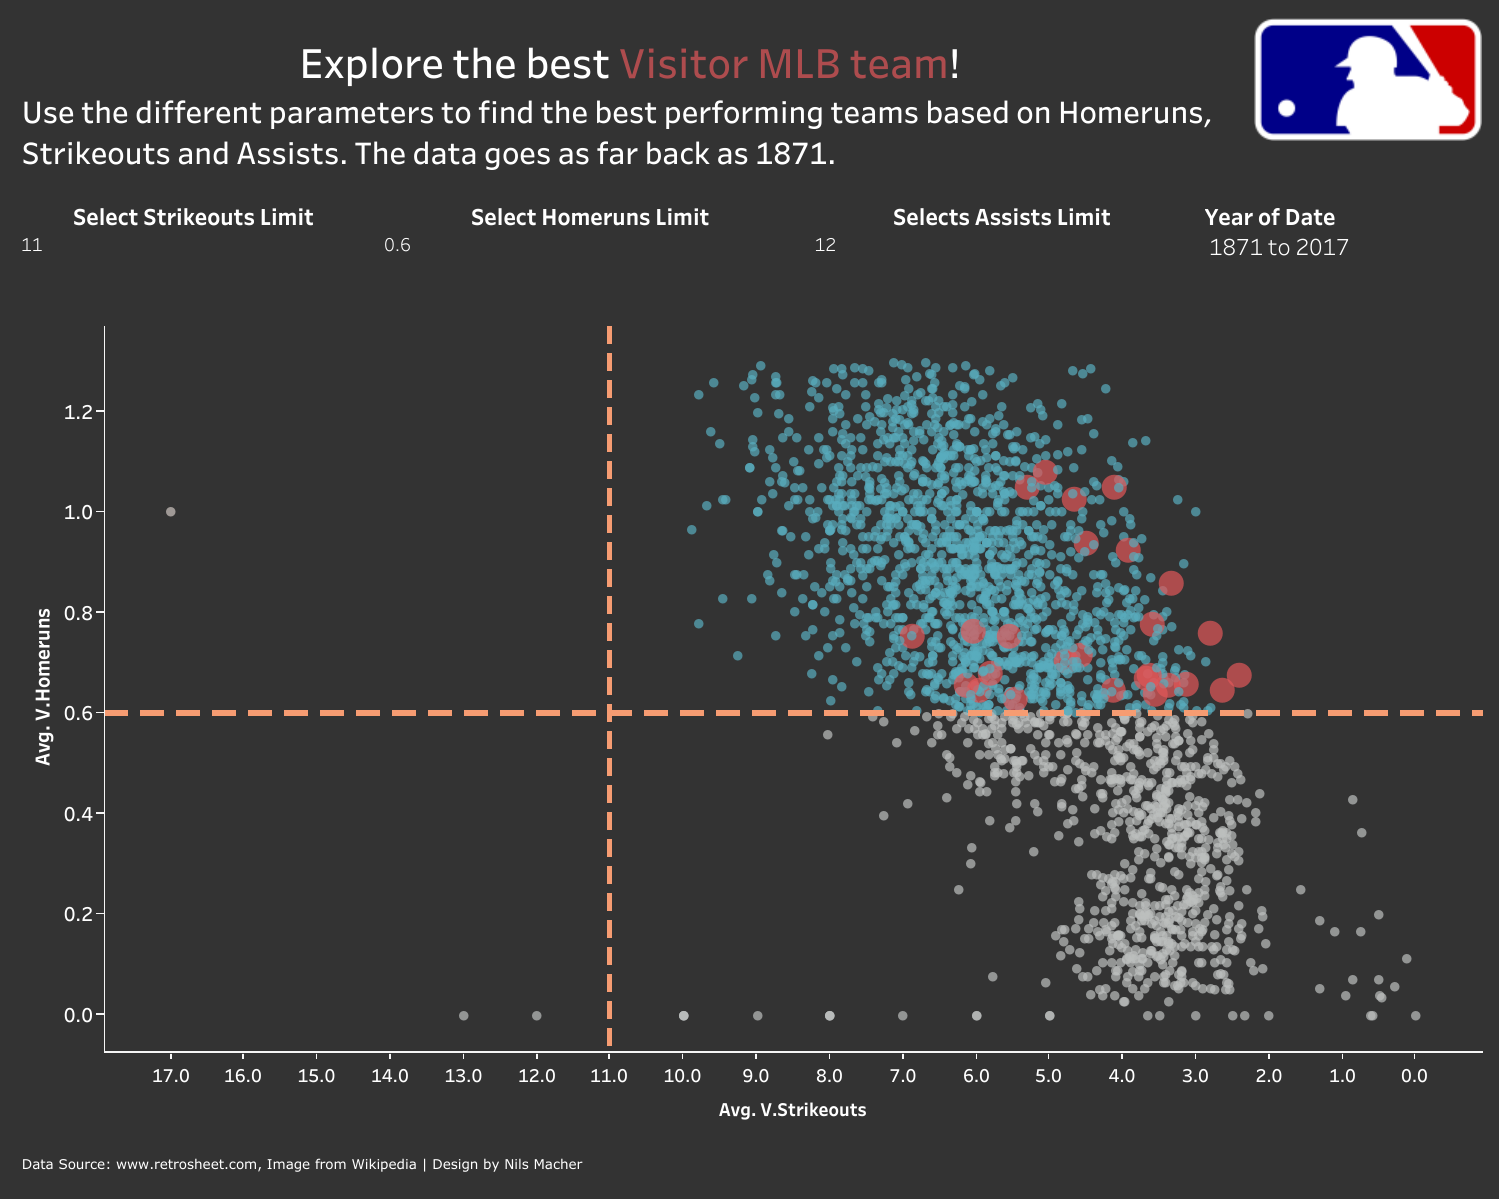
After doing some exploratory data analysis in Tableau, I decided to create a dashboard which helps you to find the best performing baseball teams per year. Based on the measures avg. strikeouts, avg. home runs and avg. assists the teams get divided into different quantiles. The teams which match the threshold for home run and strikeouts are shown in the upper right corner. The players which also match the assists limit are highlighted as big red bubbles. This makes it easy to spot the best performing teams on first glance.