Dashboard week came to an end with a data set about restrooms in Vancouver, Canada. The data was already structured in a Tableau friendly format, so no data preparation was required. Hence, I did not create an Alteryx workflow for today’s exercise.
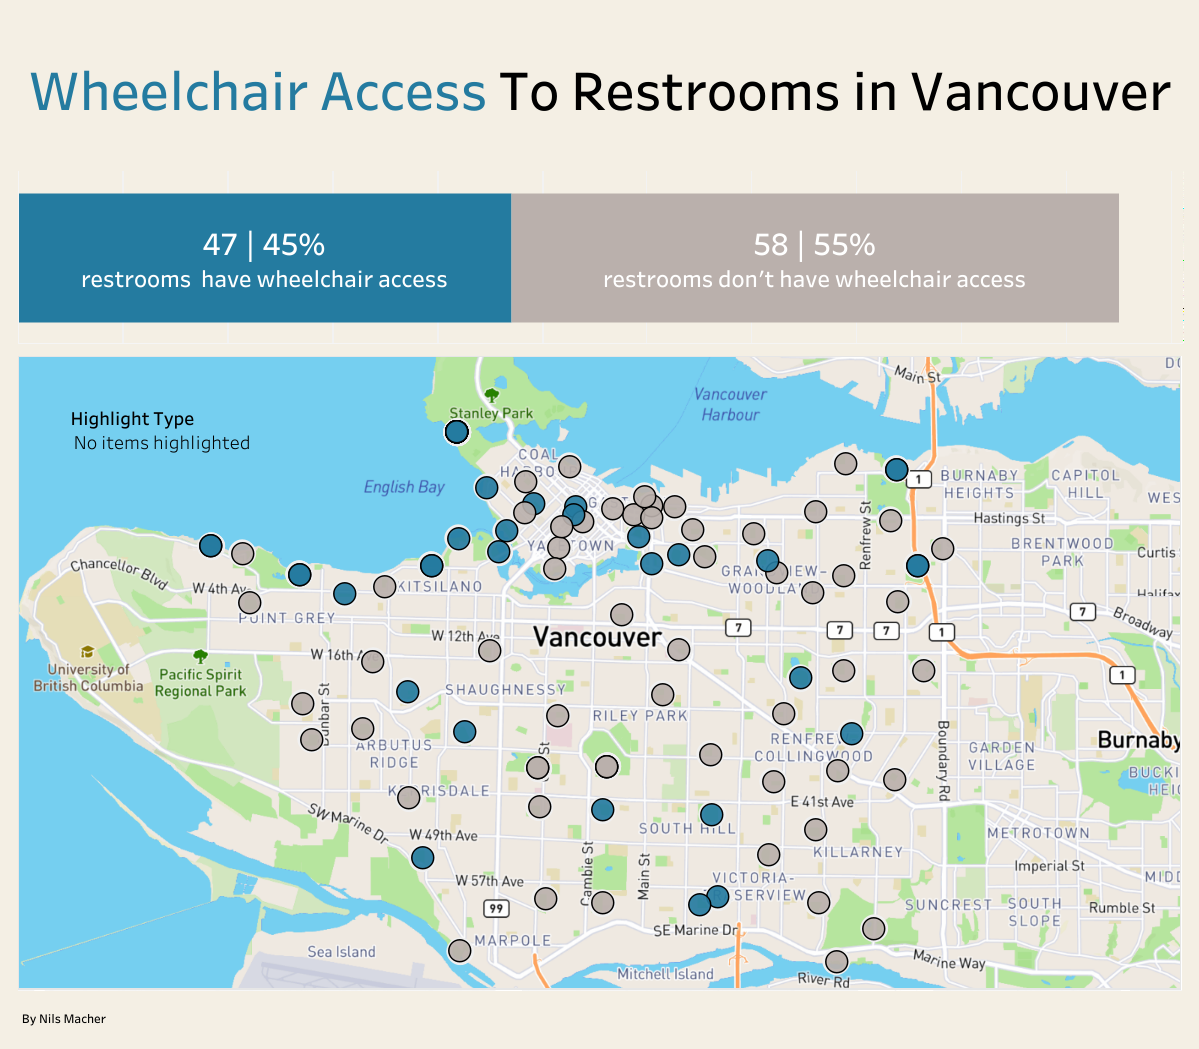
The dimensions of the data set included information about the opening times, wheelchair accessibility, type of public restrooms and latitude & longitude. Given this information, I chose to tell a story about the wheelchair accessibility in Vancouver. Using the geographical measures, I plotted each restroom on a map and then coloured each data point depending on if it is wheelchair accessible or not. Via the highlighter in the top left corner, it is also possible to highlight the bathroom type you are interested in.