One of the big advantages of moving to London is the huge numbers of amazing speakers who make their appearance in the city. So during my first week in London, I already had the opportunity to attend the talk of Alberto Cairo, the author of the very well appraised book the truthful art.
A short disclaimer: All screenshots of the slides shown in the post and in the title image are the property of Alberto Cairo.
The topic was “Visual Trumpery – How charts lie and how they can make us smarter.”
Alberto started off by given lots of example about how the importance of visualising data has increased. This is mainly because the amount of collected data and the access to this data has increased significantly. Many news media organisations use charts to educate the public about political or social issues. For example, the most popular piece ever published by the NY Times on their homepage is an interactive dialect map of the United States which will show you the probability of where you live in the US based on how you speak: https://www.nytimes.com/interactive/2014/upshot/dialect-quiz-map.html

Popular newspapers like the New York Times, The Guardian or Berliner Morgenpost have their own data journalism department.
Another reason for the explosion of the number of charts is that visualising data has become very easy. You do not need to know how to code to create beautiful and informative charts anymore. There are a lot of free resources available online which provide you with templates for visualising your data. For example https://flourish.studio/.
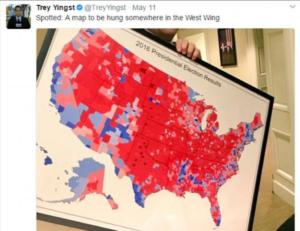
With all the new content out there, it becomes harder and harder for the reader to read charts correctly and extract the information form the chart which the creator intended to convey. Sometimes this miscommunication happens unintentionally but sometimes the chart creator intentionally wants to mislead the audience because he wants to frame the narrative of his message. Alberto shows this very illustrative and in a lot of detail by given the example of the US 2016 election results which Donald Trump likes to show to guests and has even pinned to the wall in his office.

This map is highly misleading because it does not reflect the numbers of the elections results, which by the popular vote were the following:

Furthermore, the map gives the impression that around 80% of US citizens voted for Donald Trump. The reason why this map is so misleading and distorts the election results is that a lot of counties which have a very large area but are very sparely populated fell to the Republicans. So the map shows the area of counties which voted for Trump rather than the number of people who voted for him.
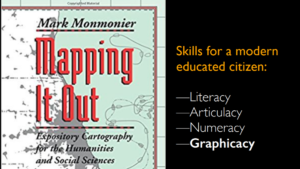
To make the audience more critical of this kind of maps and more skilled in reading charts Alberto referenced to Mark Monmonier who proposed to add an additional skill to the list of skills for educated citizens.

Graphicacy is the ability to understand and read the Symbols+Grammar+Semantics of a chart.
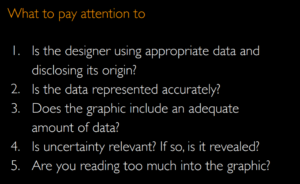
To develop this skill you should always ask yourself the following questions when reading a chart.

The talk gave a great insight into the importance of developing the skill graphicacy. By acquiring this skill you will not get deceived by charts in the future!
