The last() function can be very helpful when you want to highlight a single data point of your data series. May it be the last, second last or even the first point of the series.
How does the last() function work?
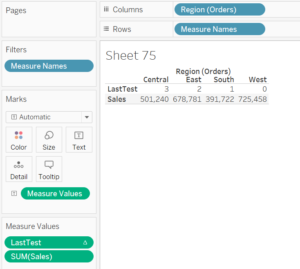
The last() function returns the number of rows the current row is away from the last row. Just create a calculated field with the following expression: last(). The behaviour of this function can best be demonstrated in a table. In the following screenshot you can see that the newly created field “LastTest” which contains the last() function counts the number of rows til the last row in the table. For example, the returned value from the last function for the South Region is 1 because this field is one row away from the last row which is the West Region.

How can we use this function to our advantage?
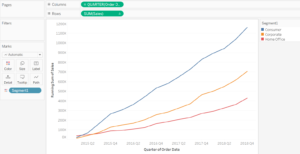
The following chart shows the running sales per segment over Quarters.

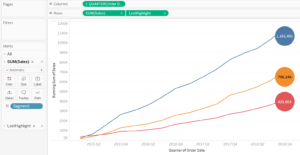
I can use the last() function in this case to highlight data points which are of major interest with a big circle and show the corresponding values inside it. To achieve this, I just create another calculated field called LastHighlight with the following formula:

This returns the running sum of sales if the last() function returns the value 0, meaning it is the last row. Else it will return nulls. With this formula I can highlight the last data point of the row. However, by the replacing the 0 with a different number, the formula can be modified to return the value of any given data point of a row.
Afterwards, I drag the newly created calculated field LastHighlight to the rows shelve and create a dual axis. Then I change the bar type of the LastHighlight mark card to circle. With a bit of fine tuning the final result could look like this:

