


#DashboardWeek started not with a bang, but more of a groan as we found out our original brief wasn’t going to work anymore. Hours of working through macros trying to parse out tables into something useful were suddenly deemed pointless in fewer than 140 characters. We received our new brief: make a dashboard on Andy’s food and drink diary from his recent holiday to Rome. Having spent most of the day in Alteryx, I thought I’d stay a bit longer and work out the distances between each of his daily pit stops. You can see my dashboard here, but for this blog I thought I’d walk through my workflow for finding those distances.
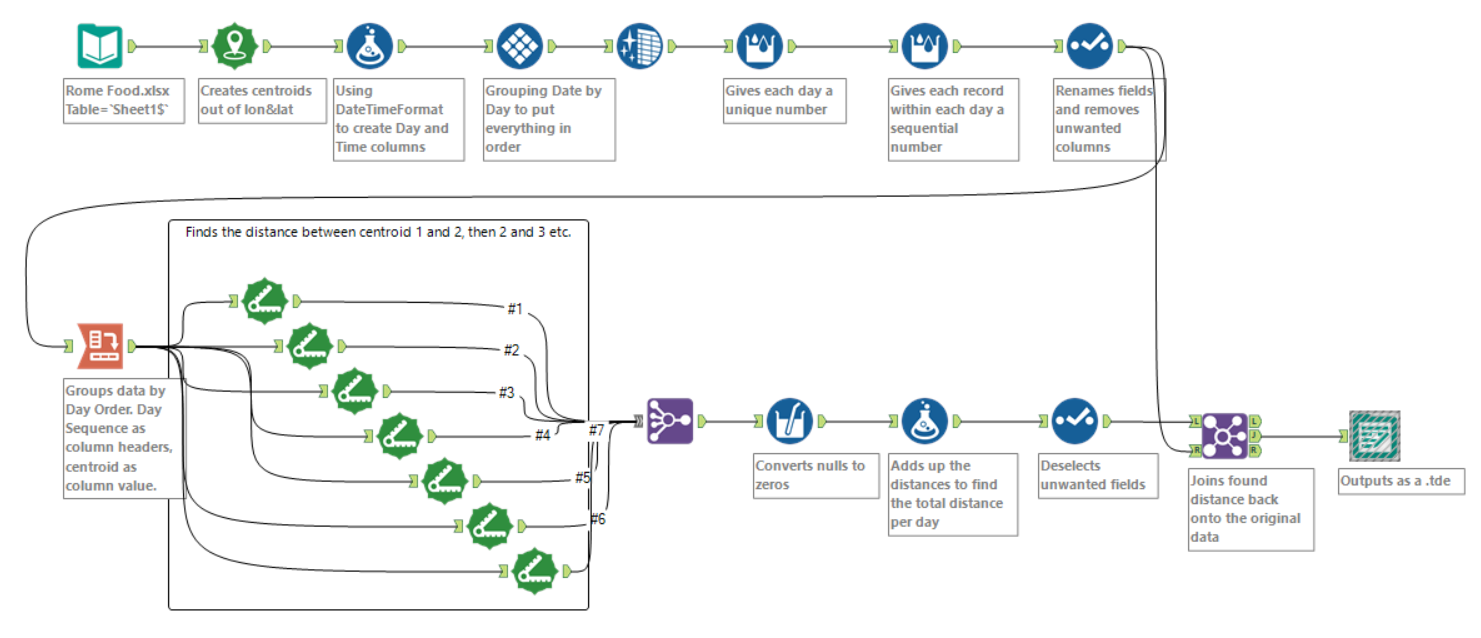
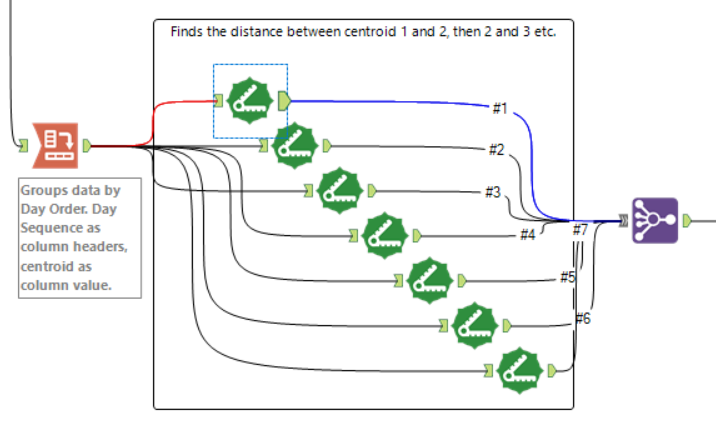
The complete workflow
Stage 1 – prepping
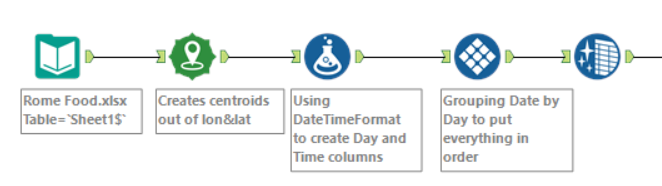
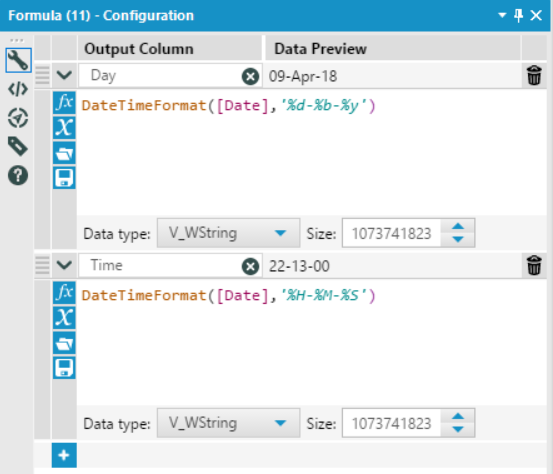
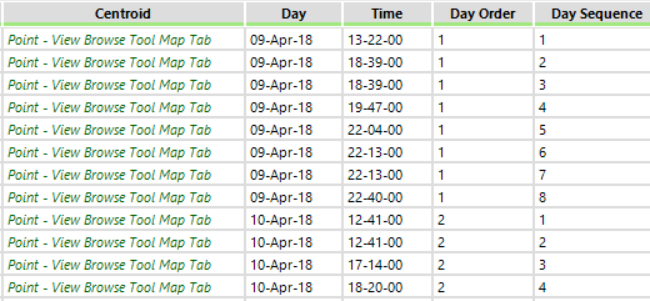
Andy was nice enough in his dataset to include the longitude and latitude of all of the restaurants he visited. This means that, once we’ve inputted our data, our first step is to use the Create Points tool to turn these into something with which we can work. The next step is to split out our datetime field into Day and Time columns. For this I used the DateTimeFormat formula (set up as below) which worked perfectly.
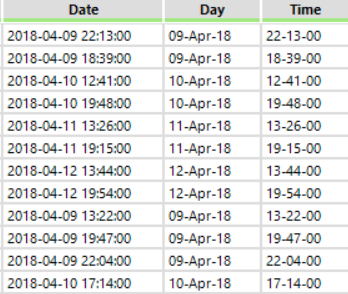
Next up I wanted to group the days together – you can see in the screenshot that they’re not in order. I used the Tile tool to do this. I haven’t used this tool a whole lot, but from what little I have it seems like a powerfully useful tool. It certainly did what I needed it to and gave me nicely ordered dates. Finally I used the Data Cleansing tool to clear up some trailing whitespace in the dataset.
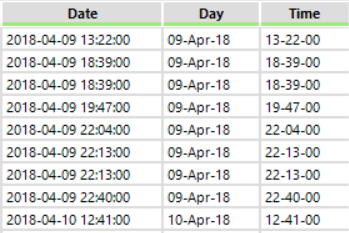
Ordered dates
Step 2 – rows upon rows
In order to work out the distance between each restaurant visited on a day, I needed a way to numerically represent both day order and intra-day visit sequence. To do this I used two Multi Row Formula tools. The first one numbers each day:
IF [Row-1:Day] = [Day] THEN [Row-1:NewField1]
ELSE [Row-1:NewField1] + 1
ENDIF
This formula looks at the row above the current row and checks to see if the day fields are the same. If they are, then it continues returning the same number in NewField1 as the row above; and if they’re not then it adds 1 to that number.
The next formula generates a sequence within each day like this:
IF [Row-1:NewField1] != [NewField1] THEN 1
ELSE [Row-1:NewField2] + 1
ENDIF
This looks at the values generated in the previous tool. If the current and previous row of NewField1 are different (i.e. the current row is the first of a new day) then the formula returns 1 in NewField2. If the current and previous row of NewField1 are the same (i.e. they are part of the same day) then it adds 1 to the previous value of NewField2. I then used a Select tool to rename fields and remove some unwanted ones.
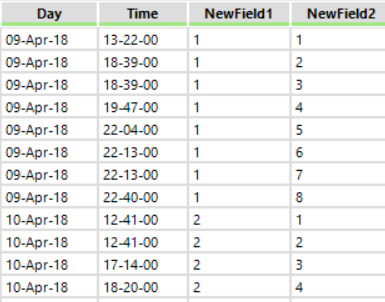
The outputs of the two multi row formulas
Stage 3 – splitting and finding the distance
Now that I’d grouped and sequenced the days and restaurant visits I needed to change the layout of the data before I could work out the distances. Using a Crosstab tool (configured as below) I grouped the data by NewField1 (now Day Order), put NewField2 (now Day Sequence) as my column headers, and the centroid as my value. In this way I went from data that was long and thin, to data that was short and wide.
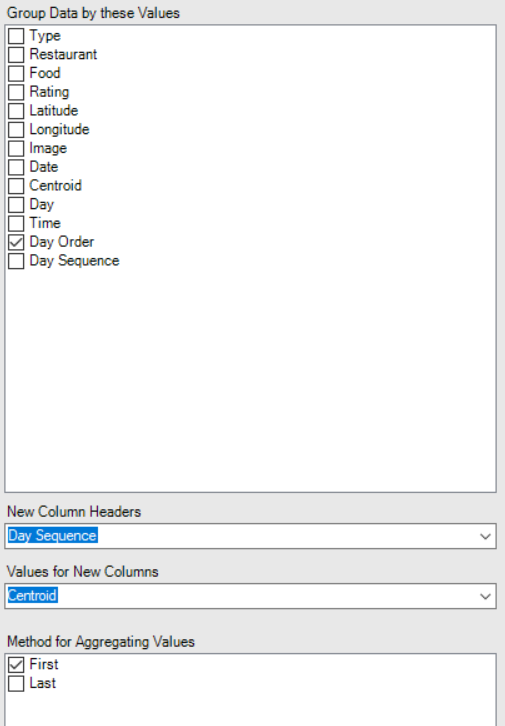
cross tab configuration
going from this…
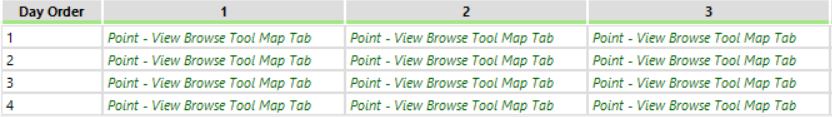
…to this
Having set up the data like this, I could then use a Distance tool to return in Kilometres the distance between a sequence number and the next one. Unfortunately, the Distance tool can only work with two points, so I had to use 7 tools to find all the distances between restaurants. I then used the Join Multiple tool to bring together all my distances.
Stage 4 – cleaning, adding and outputting
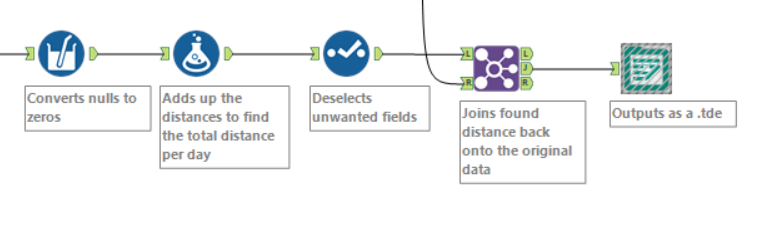
The final stage
I’d collated all the distances, but there was one more step before I could start adding them up. Andy didn’t go to the same number of restaurants each day, so there were nulls in some of the columns outputted by the Distance tools. Tableau has a handy inbuilt formula ZN which converts nulls to zeros, but Alteryx doesn’t. Not to worry though, in order to do this I used a Multi Field Formula tool to check if a value was null, and if it was replace it with a zero:
IF ISNULL([_CurrentField_]) THEN 0 ELSE [_CurrentField_] ENDIF
Now I could simply use a Formula tool to sumeach column outputted by each Distance tool to find the distance between each restaurant per day.
[DistanceKilometers]+[Input_#2_DistanceKilometers]+[Input_#3_DistanceKilometers]+[Input_#4_DistanceKilometers]+[Input_#5_DistanceKilometers]+[Input_#6_DistanceKilometers]+[Input_#7_DistanceKilometers]
I used another Select to remove unwanted fields, and then I joined the newly found distance travelled per day back onto the original datasource (joining Day Order to Day Order) and I could output my new datasource.
Unfortunately I don’t have any drivetime data add-ons so the distance between restaurants is as the crow flies. And I’m sure that Andy and co went to more of Rome than the restaurants and gelaterias in this data, but I thought it was quite a useful thing to know how to do – and hopefully you do too!
As always if you have any questions, comments or feedback you can find me on twitter @olliehclarke.