


I had never ventured onto the Tableau Community forum properly – I mean, I’d looked up some questions I wanted answers for and found some things, but a quick glance at the queries in my first few weeks scared me off; why and how am I meant to know Tableau *this well* to actually help someone answer their question?!
So after successful stints on social media for #TableauTipWeek and #DashboardWeek, the next step was to get us out there on the Community – The way that it was described to us, our objective was to cumulate the most points on the Community, but it was ultimately much more than that. We had to understand the power of the community, which Tableau themselves rightly champion.
For me, this week can be re-capped with three key points.
But before I move onto this, a note here; I felt my presentation this week was really good on reflection; I felt prepared, I knew what I was going to say and how I was going to deliver it and I felt I came across really well – There were a few stage freeze moments, but that was to be expected as I didn’t really practice out loud. But I feel since firstly the Tableau Community Conference and John Medina’s talk, as well as the session run by my mentor Brian Prestidge on presenting and how excellent presenters present as well as being able to observe the various members of the Information Lab presenting – each person has their distinct style, and this is super useful when taking the parts which we feel are most effective and applying it to our game-plan. Plus, presenting every week (including Tableau/Alteryx demos every fortnight) really helps us improve our delivery, confidence and overall ability to present. It’s one of the added bonuses from this amazing job.
So – This week in 3 points
- The Tableau Community is wonderful and weird
- QlikSense
- There’s always room to improve and grow
Let’s talk about the Community;
When you move to the community page, you’re presented with this.
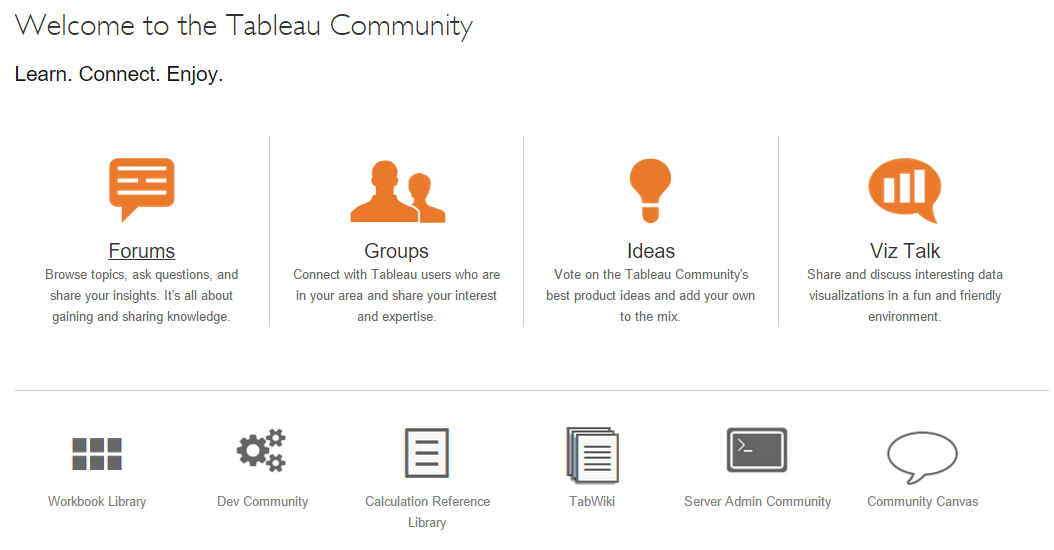
The Community ethos is actually perfect – Learn from each other, connect with like-minded people and enjoy the experience of being around such a keen community.
The three key things within this which I highlighted were the forums; where you go and find answers and post your queries; the ideas; where Tableau as a company goes to see what you, the user, wants to see from the product and ultimately where they see how ideas are brainstormed and see whether they can make the best release meet the needs of as many people as possible – this was actually confirmed to us when we Francois Ajenstat came into talk to us and explain how the product planning process occurred (the origins of level of detail are Apple-esque; giving the community a feature they didn’t know they needed); and finally the calculation reference library – This was a really sneaky community which I explored; the last entries are quite a few years old, and perhaps people aren’t as encouraged to use it – But I think (from experience, and from advice by Tim Ngwena) that a glossary of calculations, what the calculation does and where it was used would be SO useful for everyone; Calculated fields are such a powerful tool in Tableau that sharing and making it easier to hunt down the calculation you need is a no-brainer.
I loved exploring the Tableau Community – There are weird unspoken rules which I found myself adhering to, such as first dibs on a question, allowing someone who’s asking questions to see through; but with the competitive edge, us at the data school found ourselves (at first, at least) attempting to be as secretive yet efficient as possible. For me, the key takeaways were;
There are so many approaches to answer the same question, and sometimes another person’s idea and perspective is a great way of exposing yourself to things which you didn’t know Tableau could do
The different approaches and ‘best practices’ of the forum – Andy told us about this post by someone which talks about how to ask questions on the Tableau forum (which actually could do with re-circulation!) but I found seeing other people’s answering structure really interesting – so the logic behind their structure, the use of screenshots, workbooks and gifs, and the intelligent questioning asked by people.
I implore everyone and anyone reading this post to just spend some time exploring the forum – To learn different hacks and approaches, it is so important to learn.
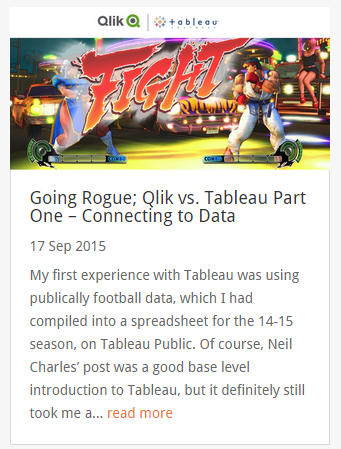
I went undercover this week, and explored Qlik as an alternative to Tableau which I have been in love with since I started with it earlier this year – and I was surprised at how I found myself defending aspects of it, especially when talking about it to my colleagues! My blog post is part one of I don’t know how many, comparing the connecting to data part of the process (I will be writing about creating a visualisation in Qlik in my next post after my graduation ceremony) – But I also had a look at the example ‘Apps’ within QlikSense and I found myself understanding the value and why some companies might prefer to use QlikSense as a program, than the likes of Tableau – Both are relatively intuitive, but I felt (from what I’ve seen) parts of Qlik still needed levels of coding which I am slowly developing understanding of, but still don’t’ have a full grasp of. Well see how I get on – But it feels fascinating being an objective observer of the ‘other side’ as it were. Following the community feel, getting awesome responses and comments on the post really has spurred me onto blogging more in the last few weeks – Especially when I’m getting valuable feedback from different people.
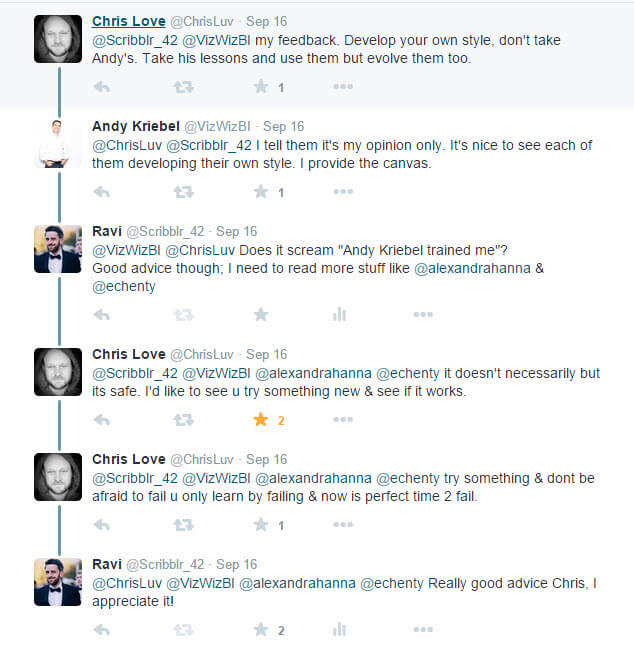
Finally, I’m going to reference a Twitter exchange between myself and Chris Love following our effective dashboard design class on Wednesday – Which must seem very basic, but for me highlighted a few truths which I had not given as much priority.
There are certain styles which parts of our group, for instance Emily’s influence by the likes of the New York Times’ visualisations in a very informatic (is that insulting? I mean it in the best way), journalistic format which is clean and informative, and Sasha’s clean yet informative dashboard design – They have both been reading a lot of books, and it really has begun to show in their work that they’re considering parts which I at least am not thinking about given not being exposed to enough – And I really need to do more to get better, to improve, try different things and as Chris says, there is no better time to fail, get feedback from some of the best people in the industry and learn from the mistakes we’ve made. So on the back of this, I’m more motivated than ever to read as many blogs as I can, get through the Data School Library as best as I can and connect with and talk to other Tableau people more. (NB. If you have any specific recommendations, please let me know!!) Constantly improving and learning new things is one of the real reasons I wanted to join the Data School, and the amount we’ve gotten through in just three months is incredible. Simply incredible and it seems like yesterday that September seemed so far away!
I’m going to be disappearing just under a week now as I travel to pick up a scroll confirming I have an undergraduate degree, meaning I’ll miss three days of the data school – But this week has really encouraged me to reach out more, connect more and do as much as I can to not only develop my skills but also learn with the community at large to just simply be better and better!