Table Calculations are a major part of calculations within Tableau, allowing you to do complex along the row calculations as long as everything is within the view (within a marks card or column/row shelf). It is possible to start these calculations in either 2 ways. Table calculation have been in Tableau for quite a while but until Tableau 10 you have been able to do them in a much simpler way. I will quickly go through how they were originally done as this can be helpful for understanding and can sometimes be quicker than using the simpler new method. Beforehand though I will just explain what a moving average is and how it works.
What is a moving average?
A moving average is exactly what it says on the tin, it’s an average (usually the mean) that follows the latest input by averaging the previous X amount, so if we had a data set that looked like this:
| Days | Result |
| 1 | 5 |
| 2 | 2 |
| 3 | 4 |
| 4 | 7 |
| 5 | 2 |
| 6 | 1 |
| 7 | 3 |
| 8 | 4 |
| 9 | 2 |
If we wanted a 5-day moving average, the following equation would be correct for the moving average of day 5:

We would therefore have a 5-day moving average of 4, for day 5, we would then move onto average the moving average of day 6, this would be the following equation:

As you can observe by changing the day, we lost the first value and replace it with the newest value, but the denominator will remain the same, 5. This is normally used to smooth out volatile line graphs to get a better understanding of trends as they are clearer from a moving average line. A very common use for these is within stock trading where the 30-day, 50 day, and 100 day moving average are commonly used to better explain stock trends and take out intraday volatility.
The old method
The original method was to use normal calculated fields, so basic syntax functions, that would calculate the valuables that are available on screen. This was a slow process, and not understood by the majority of Tableau users, and in turn was not a great policy for Tableau, who’s intention and goal is to make data as accessible as possible.
In equation form the moving average for 5 days would look like the following –
WINDOW_AVG(SUM([Profit]), -4, 0)
The window function is informing Tableau that it should be using all that is within the view, and that this should be averaged. The Sum of profit is defined as the target variable and -4,0 is telling tableau to compute the previous 4 values, 0 of the next values. It should be noted here that the 5-day moving average also includes the value ITSELF so it should be set to 1 less than you are looking for, this is commonly overlooked so always be careful.
While this is simple in this form, they can become quite complex due to the ability to add secondary calculations and a need to define which field was being used to define the average (so in a time series for example, whether this moving average was defined each month, quarter, or year etc.) this is where they can get quite complex. There is also an element of inability to change on the fly, something that many Tableau users desire.
The new method
For this reason, Tableau introduced Table calculations in Tableau 10 and this allowed them to be applied much more easily and powerfully. I will now guide you through how to implement a moving average within Tableau. If you want to follow along with identical data, I will be using the most recent version of superstore, something we learn off by heart at the Data School.
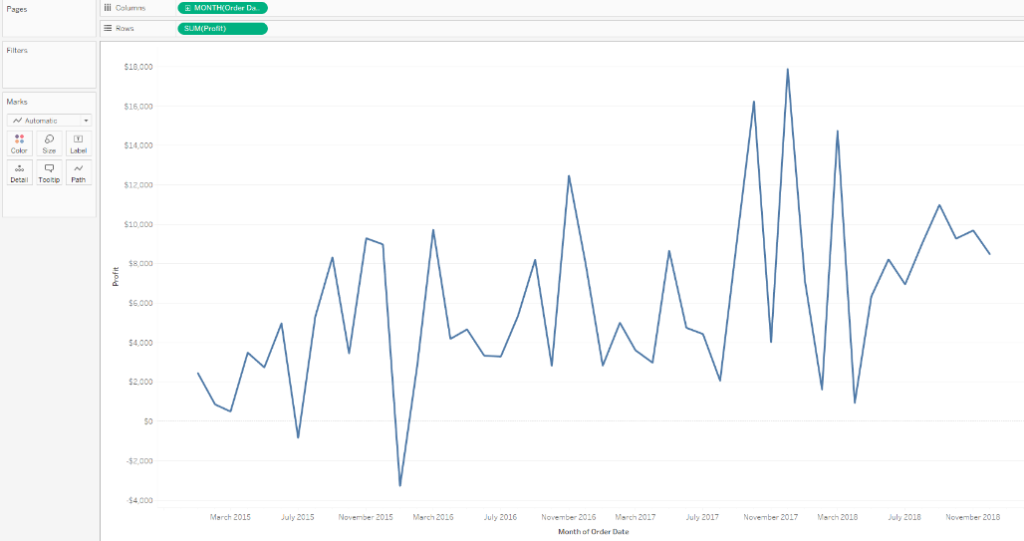
Firstly, create an ordinary line chart, I have decided to look at the overall profit by the order date month.

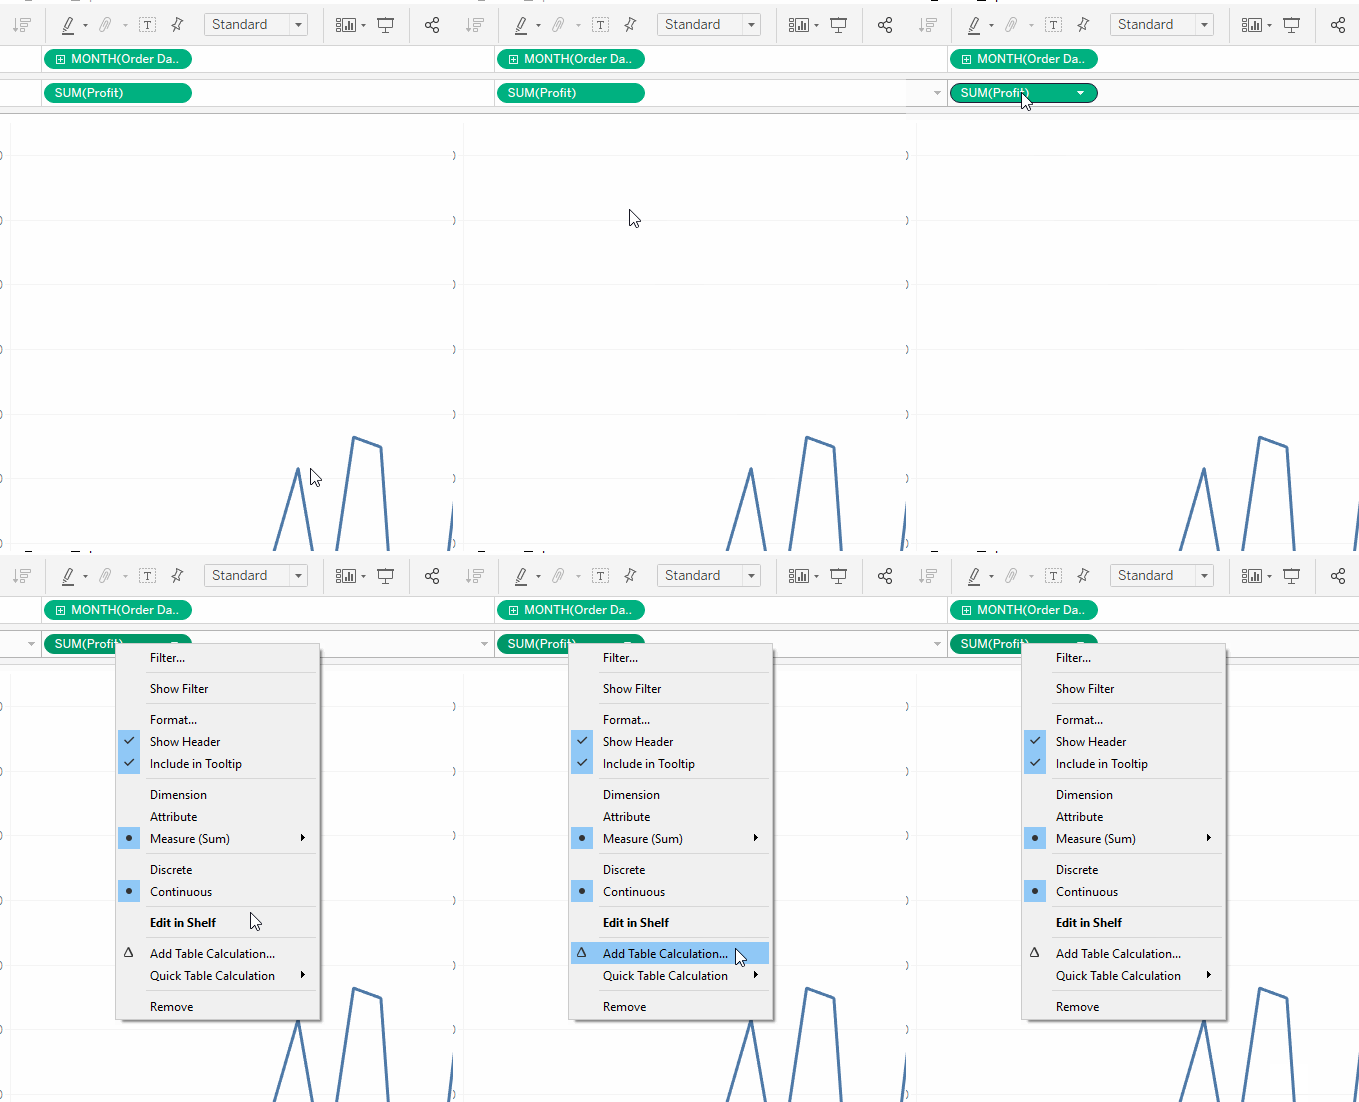
To apply a table calculation you need to right click on the sum of profit (or whatever you are averaging) and find the add table calculation about half way down.

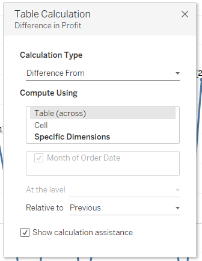
This will bring up the following window:

Allowing you to customize how your table calculation will be defined. This will allow you to select from the following :
- Difference From
- Percent Difference From
- Percent From
- Percent of Total
- Rank
- Percentile
- Running Total
- Moving Calculation
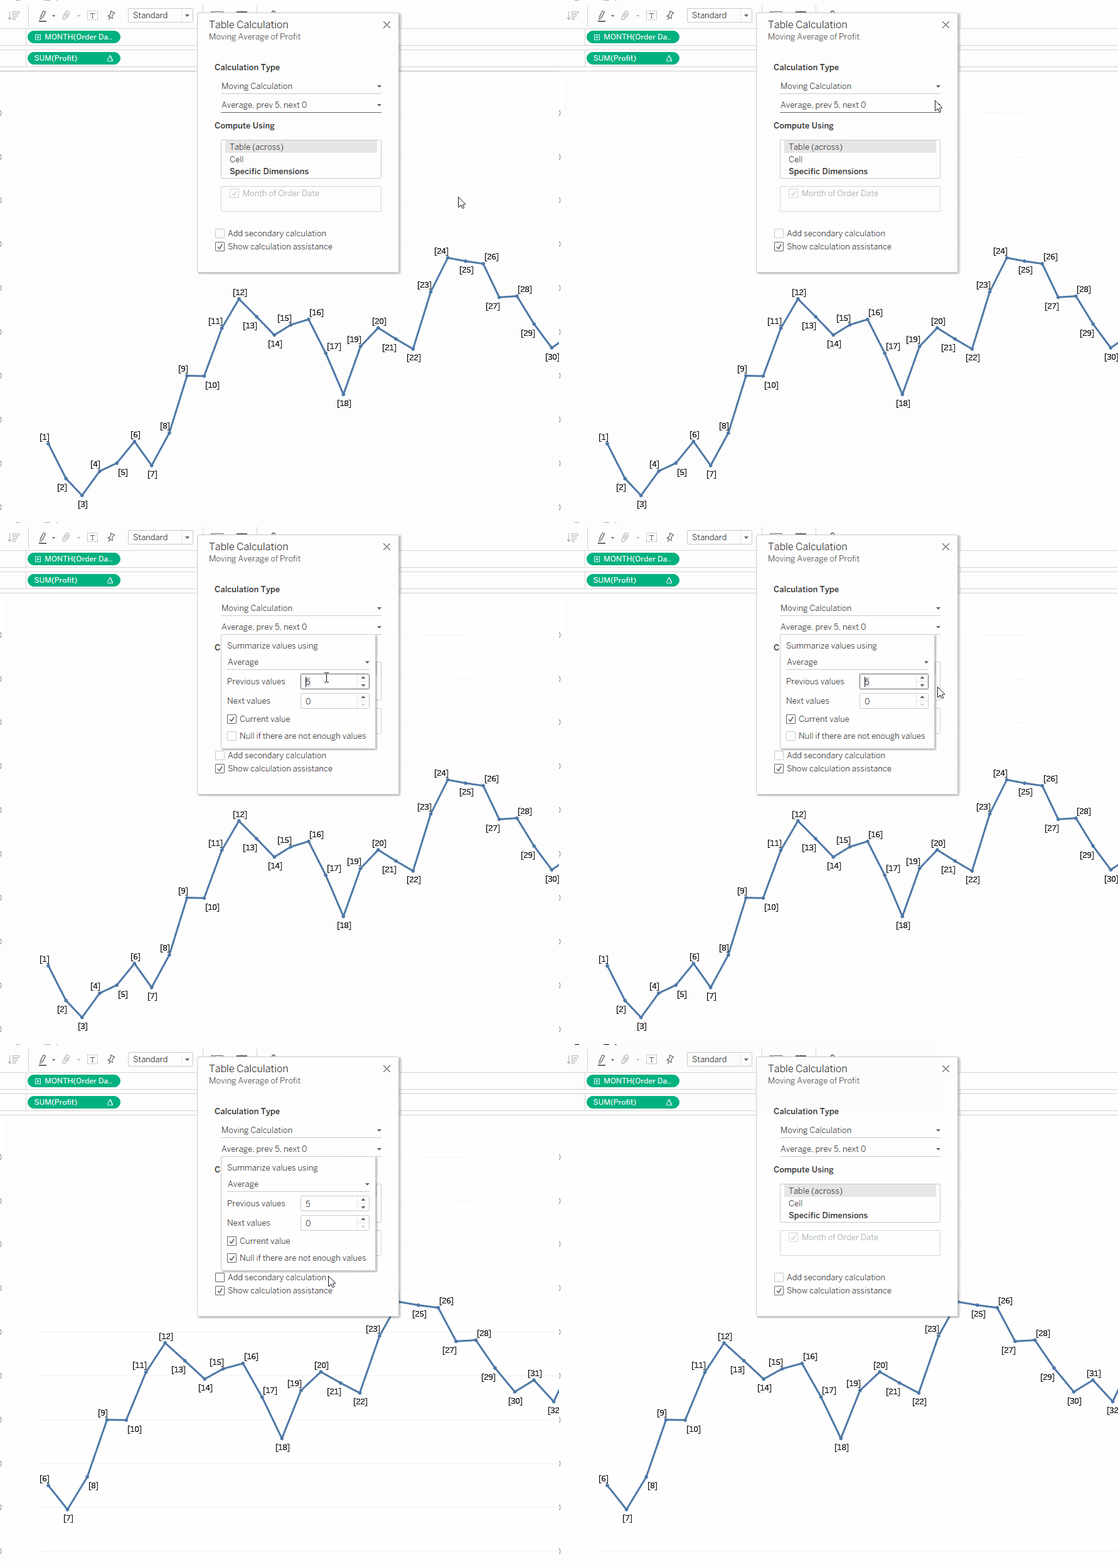
We will be using a moving calculation, it is also possible to do moving sums, moving maximums, and moving minimums within table calculations. Once this is selected you will need to define this as average by using the drop down that should (as its default) currently be set to sum. You may also notice that all points on the line chart have been given a number, this is to define the order which Tableau is using to calculate the table calculations (this can be turned off by unticking the calculation assistance button); this comes in extremely useful if you need to quickly change the time frame this is defining.
Within the Average drop box, you will also find the number of steps that it wants to take, unlike previously you now have the option to take the current value out of this equation though I would as a rule take into account the current value for the moving average. For a 6-month moving average it would look something like this:

I have also nulled here, as the 6-month moving average is extremely in accurate for the first 5 months due to the many 0’s that are present. You could also move the year to the view, this would allow you to catch the 6-month rolling average split by the years. The final thing you may notice is a symbol has now appeared next to the value being calculated:

This symbol defines Table calculations, whenever you see this symbol on a workbook you will be able to edit the Table Calculation in this manner. It should be noted that this is a rather simple table calculation and more advanced techniques can be used for greater insights and understanding of the data.
