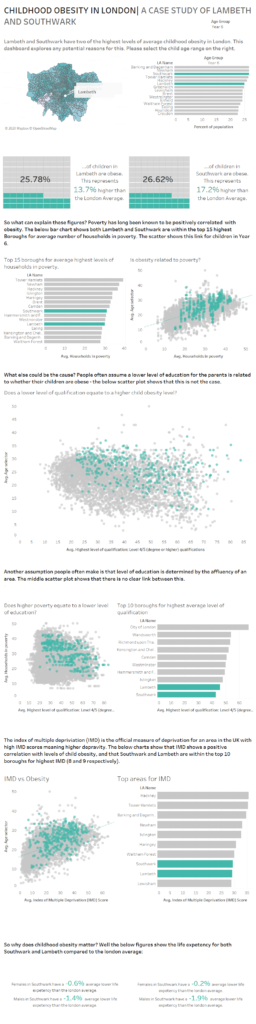
Day four provided us with a chance to practice our dash-boarding skills, which was a welcome reprieve from the data-prep-heavy week we have had so far. We were provided with data from Guys and St Thomas Charity that concerned childhood obesity – for those who have participated in Viz For Social Good this data set may sound familiar to you.
We were tasked with producing a visually appealing dashboard that included a custom Mapbox map, a parameter or set action, and animations all done in Tableau 2020.1. Of these assignments, i failed to include a parameter or set actions (time constraints, please believe me Andy).
After looking through the data i outlined a rough idea of a dashboard – i knew i wanted to include the measures of poverty and education when looking at childhood obesity, and then to add to it further down the line. I started with creating a Mapbox map. Having never used this software before i had no idea what i was doing – and the first hour or so i achieved nothing other than cutting out a shape of London, of which the bit i could customize was the parts that were everything BUT london. Not a great start.
After this, I used Alteryx to cut out a shape file of London that allowed me to overlay a cut out of London that i could then customize. I did this through the use of the Spatial Process tool shown below:
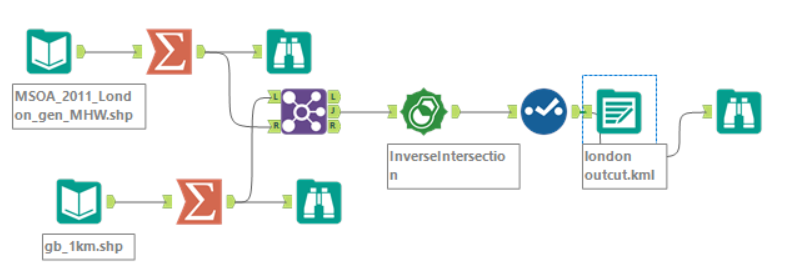
It provided me with a map i could customize and the results are below… i realise that this is not the nicest looking map but hey ho, i had no idea what i was doing and in the end.. it got covered up by Tableau.

So… to Tableau. It took me a while to get my head round what i wanted to portray, and so i started by making several exploratory charts. The link between poverty and childhood obesity was one i expected, but when i looked into education (of the parents) and obesity levels i was surprised no correlation was present. Perhaps that was a cynical view from me – but an interesting insight none the less. I tried to make my dashboard have a story like flow to it, but due to the time it didn’t come out quite as id have liked. I tried to end the dashboard with a ‘ why does this matter’ message – i did this by displaying life expectancy and how Lambeth and Southwark had a lower than average. It was my first attempt at creating a longform dashboard and below are the results.