


Today’s assignment was to create a dashboard based on metadata about Body Camera usage in the New Orleans Police Department. The data consists of one entry per recording that was uploaded to the NOPD’s archives, with time stamps for when the recording was started, how long it was, when it was uploaded, what police district the wearer was part of and other more or less interesting metadata. On top of that we weren’t allowed to use Alteryx, but if necessary should resort to Tableau Prep.
Prep
Most of us went off and started looking for some additional data to supplement our rather meagre data set with. Thanks to the Open Data intiative, such data isn’t very hard to come by. I found that in the body cam metadata, there was an external ID field which links the entries to other data sets in the NOPD database. I found a log for every police report filed, with one CSV file per year. I grabbed a data set for every year that was relevant to me (the body cam scheme was launched in 2014) and launched Tableau Prep.
I wasn’t able to join the data as neatly as I had hoped: There are lots of police reports without corresponding body cam recordings, as one would expect. However, there are also tons of body cam recordings for which there is no report. So we only know what the actual circumstances were in about 20% of cases.
Sketchy Start
I was happy to proceed with what I had. I played around and tried to get a hold of the data for quite some time, trying to find some interesting patterns. In the end I decided to compare every district to the city average in three measures: Growth of body cam use, the delay between when the recording was made and when it was uploaded, and the events that most frequently spark a body cam recording. I made a very (!) rough sketch of what I thought this might look like and started building a dashboard.
Masterpiece.
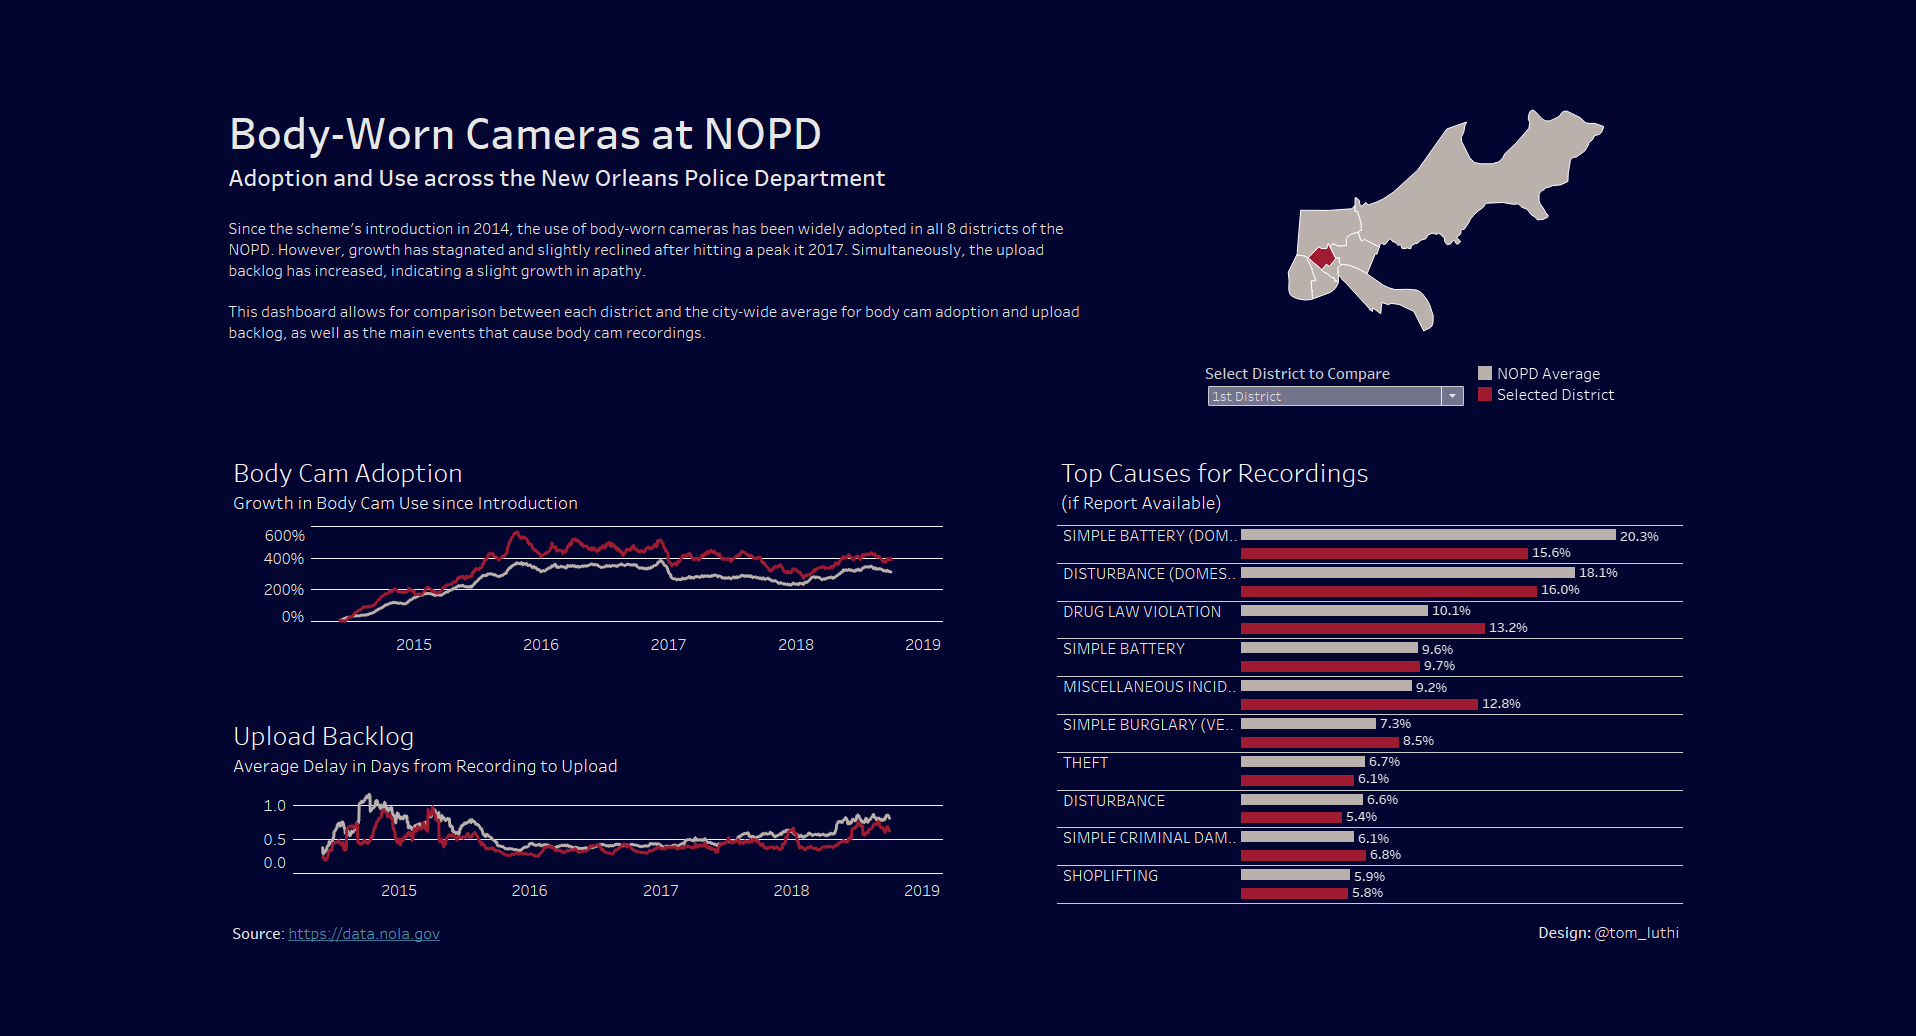
I’m still not very comfortable designing and constructing dashboards. However, I think I’m struggling less than I used to by focusing on a few key insights so as not to get bogged down in detail. In the end I’ve got something which I think might be useful for someone interested in body cam use within the NOPD. It was too late that I realised it might also be a nice feature to allow for comparison across districts, and not only one part to the whole, but by that time I had made my bed with the way I had build the parameters and calculated fields, so here I am, lying in it.
Find my viz on Tableau Public.