Word clouds don’t have the best rep, but they can be a powerful tool to represent text-based data. There are tons of great manuals for how to build a word cloud in Tableau, so I won’t get into the details about that here. One thing I will say is that with word clouds, data prep is everything. If you don’t structure your data before visualising it, you will end up with a head of “the”s and “and”s and “of”s that don’t tell you anything worth knowing.
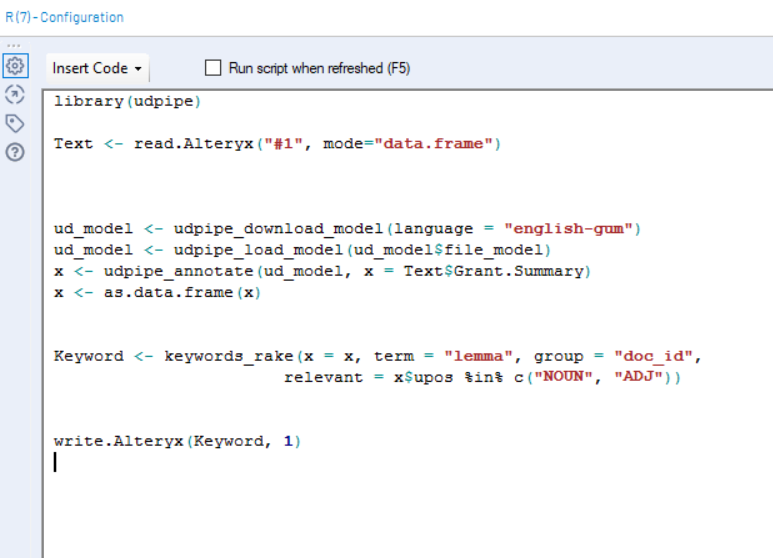
I have structured my data using an R package called UDPIPE. I installed the package and used the R tool in Alteryx to first transform my data into a tidy format, then to analyse the string field that I was interested in. UDPIPE has several methods of finding relevant words in your data that go beyond just counting the frequency in which they ococur. I used an algorithm called Rapid Automatic Keyword Extraction, or RAKE. RAKE essentially looks for groups of words that occur frequently and together. For example, it recognises that the phrase “and I” occurs frequently in a text, but it also recognises that both its component words, “and” and “I”, respectively, also occur frequently with other words. On the other hand, if we were to run RAKE through this post, the keyphrase “word cloud” will be ranked more highly, because the two words always appear together. If you want to try this method, this is the code I used to run the model through the R tool in Alteryx (after I had installed the udpipe library using the R installer app from the Alteryx public gallery.)

Using tools like this one allow us to structure text-based data and find deeper insights. Once our data is prepared and strucuted, we are ready to load it into Tableau.
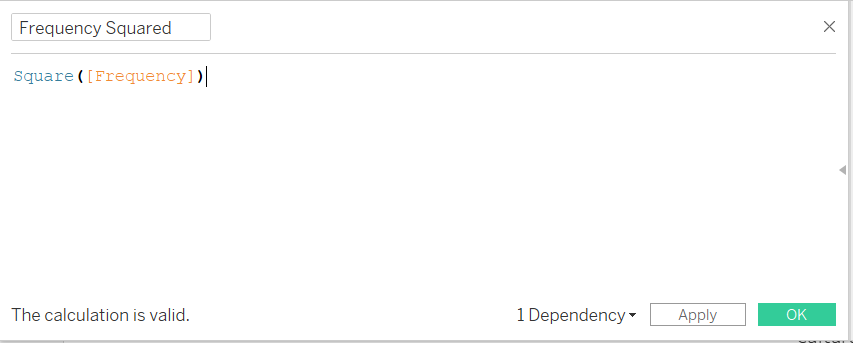
One thing I struggled with is the fact that when the measure we use to size the words in the cloud doesn’t have a wide enough variance, the words won’t differ in size enough to tell them apart. Unfortunately, there is no way to adjust the minimum and maximum size by using the sizing legend – that only works when we use other mark types. I managed to solve this issue by creating a calculated field and adding the SQUARED formula to my frequency field, like so:

We have now made the sizing scale exponential, which will make the more frequent words pop to the foreground. It’s a useful workaround when trying to make the most frequent words stand out, but beware – you are essentially skewing your data. But as long as you make sure you’re using the proper measure in tooltips and other graphs, I’m sure your users will forgive you.
