


Data School application process
As a part of the application process to Data School each candidate should submit a Tableau Workbook on any subject (if you get in you will have to do your Data School submission makeover). There used to be around 4-week window for applying, but this has now changed and you can send yours anytime! Make sure to subscribe to Data School newsletter to learn about the dates of 1st stage interviews. They take place around 3 times per year.
If your submission qualifies you will have a quick Skype/phone call. It will include a feedback on your viz. A couple of weeks later you will receive a dataset and will have around 2 weeks to prepare another workbook. This time you will present it in person at the office in front of The Information Lab consultants. On top of that, there will be a traditional interview as well. It takes place right after the presentation. Throughout the whole process, you will be strongly encouraged to ask questions and ask for feedback on your work. Make sure to make a use of it!
My application
My first submission was a workbook that used NYC felonies dataset. That was the first set and viz I had ever done in Tableau. I happened to start working with this dataset right after finishing watching the 2nd season of Daredevil on Netflix. That sparked the idea of looking at Hell’s Kitchen felonies from Daredevil’s perspective.
What did not work:
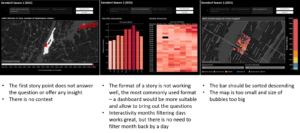
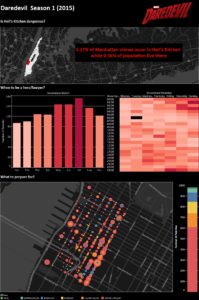
What works in the makeover:
https://public.tableau.com/views/DaredevilMakeover/DaredevilSeason12015?:embed=y&:display_count=yes
- The design – overall look & feel
- More visible questions
- Key takeaway in the textbox
- Context of population size added for comparison
- Getting rid of unnecessary filtering
- Seasonality and heat map charts
- Soft colours
- Bigger crimes map
- Bar sorted in descending order
- Bar working as a filter for crimes
Wiktoria