


One of our projects a couple of weeks ago was to create an Alteryx app of our choice that would bring in data from an external API and create an output in Tableau. My idea for this project was to connect to the NetflixRoulette API and via a user input, output a graph showing all of an actors sorted by year of release against Netflix ratings. This could possibly show if an actors films have become better or worse over time, according to Netflix at least.
The workflow I created is show below:
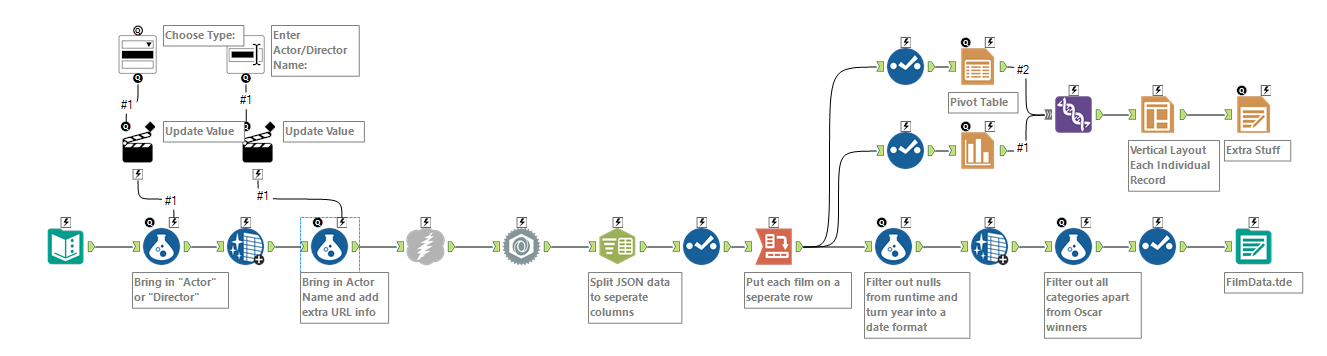
Workflow showing my Alteryx App
The process is relatively simple, It brings in the base API URL (http://netflixroulette.net/api/api.php?) and then appends either “Actor” or “Director” to that URL, changes it to lower case and then adds in whatever the user inputs. In this case we are asking the user to input the actors name. This then runs through the download tool to access the API and then the JSON parse to turn that data into an Alteryx friendly format. The “Text to Columns” tool then splits up the raw data into Headers and Values which is then transposed to put each film on a seperate row of the data.
The branch of the workflow that heads into the reporting was purely experimental and just so I could see what the Alteryx default reporting would look like compared to the Tableau reporting. This is what is produced by the reporting tools:
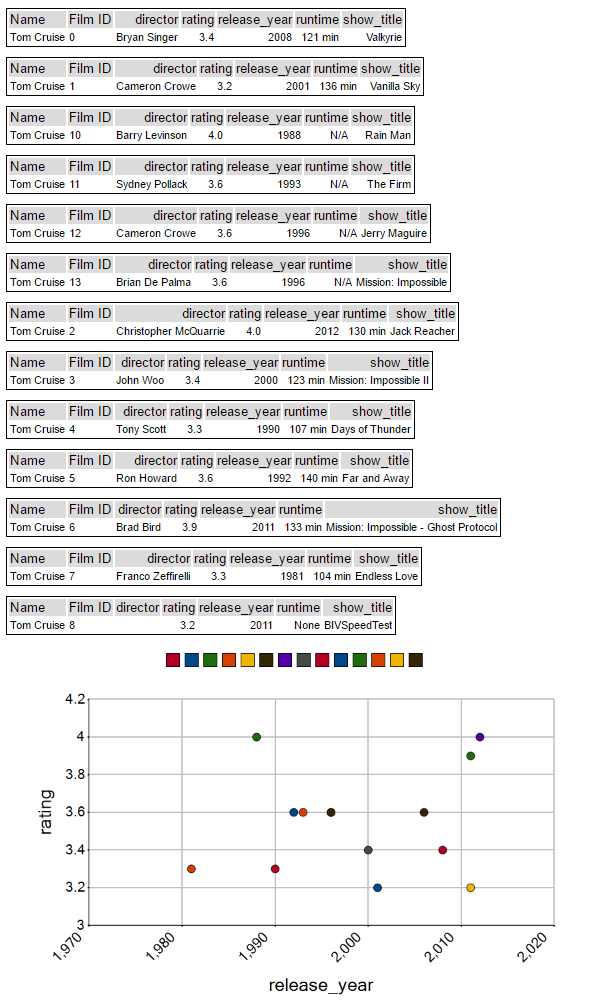
Output from Alteryx reporting
The rest of the main workflow is just cleaning up the data so it can be used in Tableau without any issues. We have a formula that filters out nulls from runtime and turns the release year field into a Tableau friendly date format. Also I have filtered out the categories that are not “Oscar Winning Movies” as this will alter become a filter I use in Tableau. The final tool is an output to a tde which I will then use in Tableau.
When the app is run In Alteryx it brings up a user in put box that looks like below. This allows users to choose whether they are looking for films either containing a certain actor, or films by a certain director. Then the user can input a name of any actor/director and run the app.
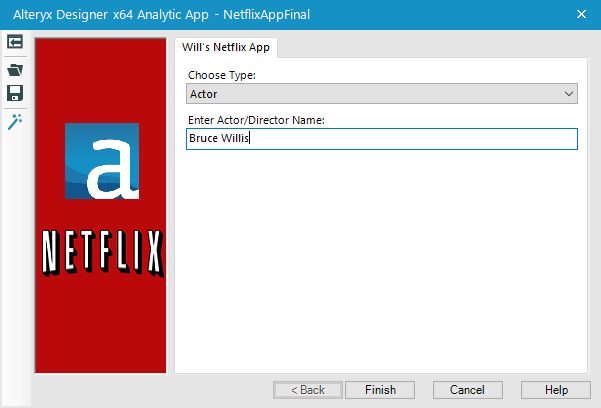
App User Input
When the tde is created we can open it in Tableau and create some charts from the data:
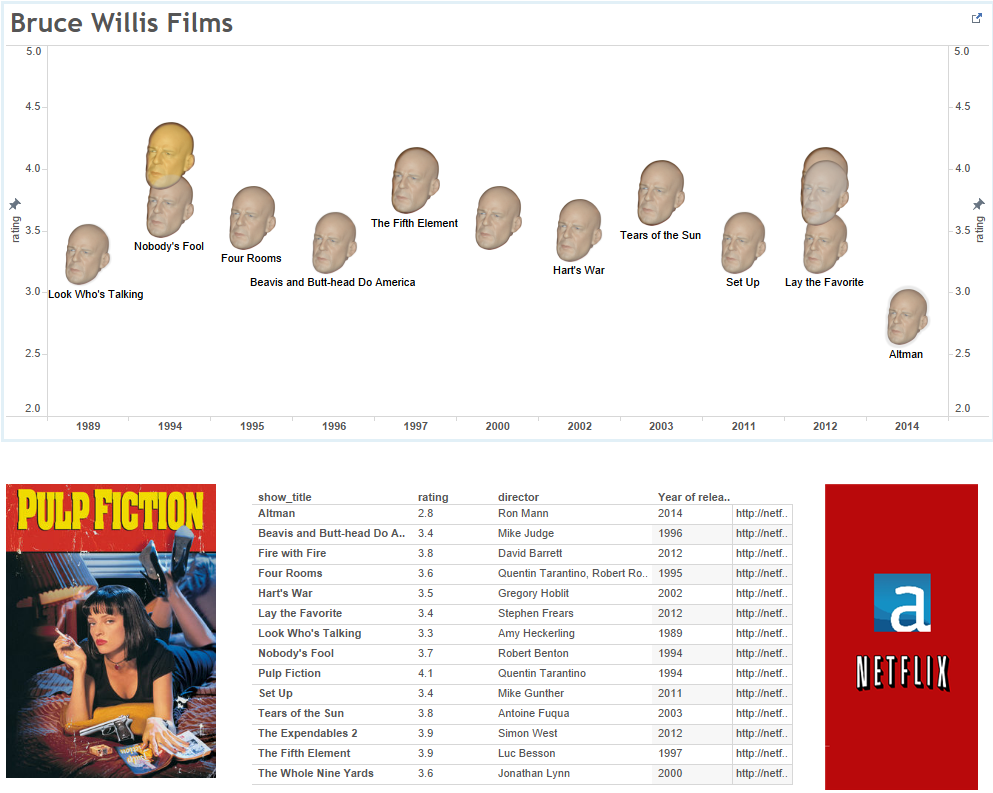
Film data in Tableau
The chart I created maps the film rating against the year of release, with the Oscar winning film highlighted “Gold”. It also allows users to click on a data point and bring up the movie poster for that film. Finally there is a table containing all that actors films that is sorted alphabetically, which shows the rating, director and year of release.