Running Total is probably the most used Table Calculation in Tableau. It is used to calculate a cumulative total of a measure across a specific dimension or table structure. The
When a running table calculation is defined the first thing that needs to be selected is the type of aggregation to use when summarising the values. The most common of the 5 choices will be Sum (RUNNING_SUM) as this will result in a total summation of values, however there are 4 other, less used, options. These are the running total of Average (RUNNING_AVG), Count (RUNNING_COUNT), Minimum Value (RUNNING_MIN) and Maximum Value (RUNNING_MAX).
Secondly you need to specify a dimension for the total to be “run along”, this can either be changed to different table structure (Table/Pane/Cell) calculations or a specific dimension, by default this will be set to “Table (Across)”.
If you have selected a dimension to be “run along” you sometimes need to specify when to restart the at zero and begin totalling again.
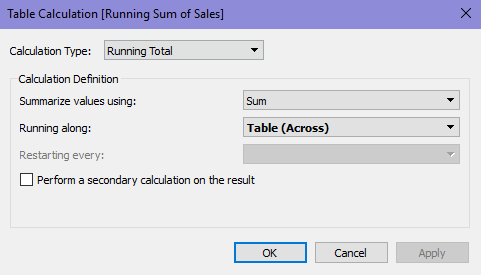
The following is an example of a Running Total calculation setup window:

This is probably the most basic set-up, just calculating the running total of Sum of Sales across the Table.
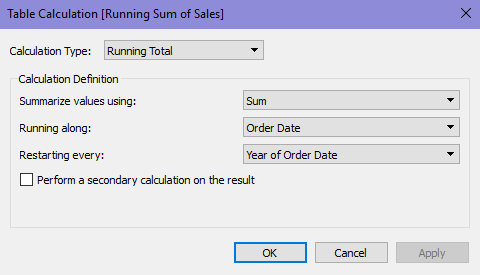
In our current view this has just given us one straight line for all sales, to add further information such as calculating the running total for each year we can alter our calculation to this:

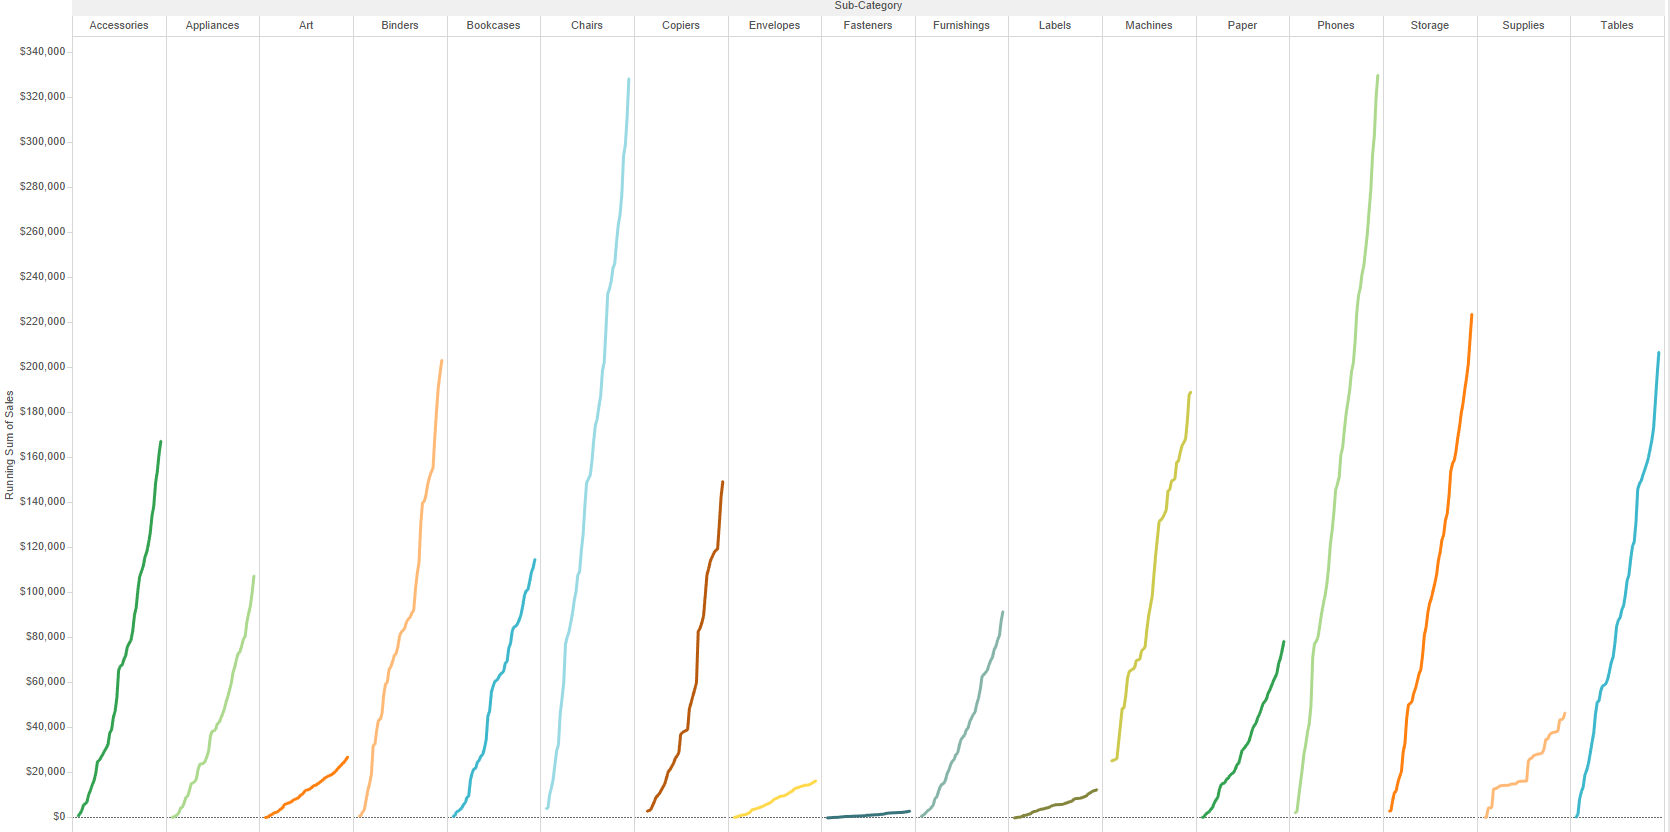
This has changed our chart as show below:

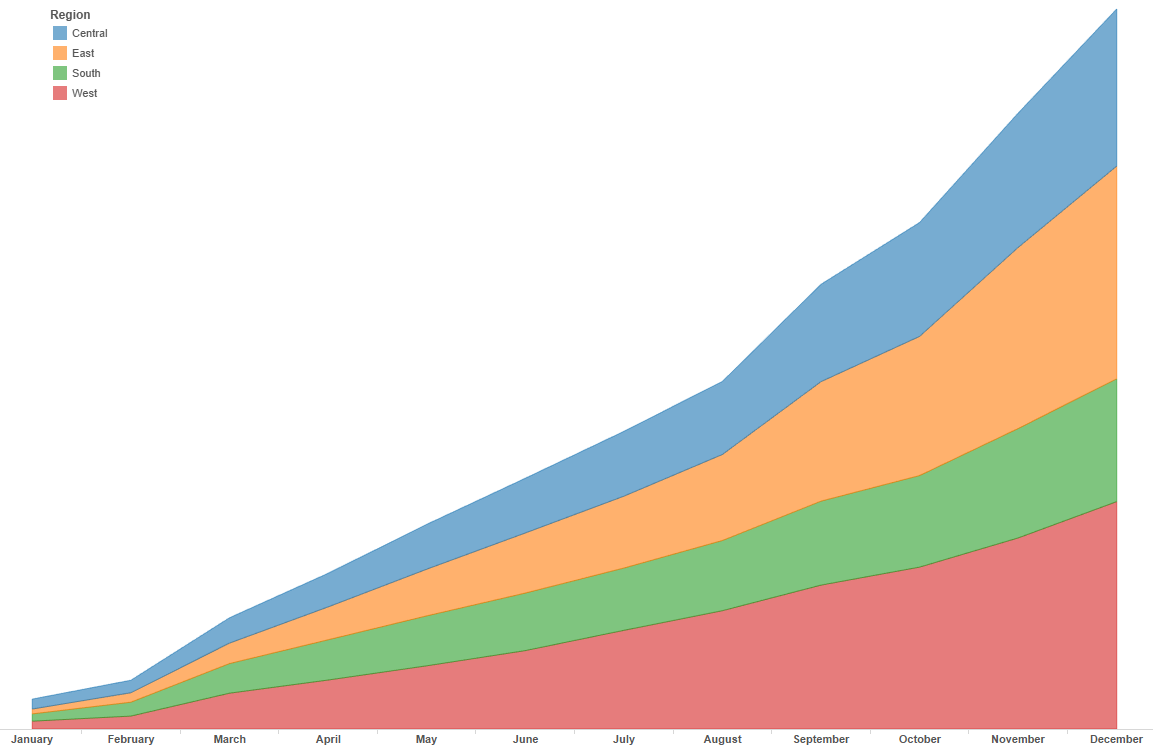
There are many other uses for running total, some example visualisations are listed below:


