


For our project this week we are looking at public data regarding the NHS. One of the key bits of information they wanted to look at was the data by Lower Layer Super Output Area. A Lower Layer Super Output Area (LSOA) is a geographic area. LSOAs are a geographic hierarchy designed to improve the reporting of small area statistics in England and Wales. Each LSOA has an average population of 1500 and range between 1000 to 3000.
Half of the data provided has already been assigned an LSOA code such as the demographic and socio-economic data. However for all the other data we want to map we need to assign each Hospital do a specific LSOA. These LSOAs then sit inside LADs (Local Authority Districts) and alternatively CCGs (NHS Clinical Commissioning Groups). These can provide overarching information for large areas.
To help our data visualisation practice we wanted to create a hierarchy going from LAD and CCG down to LSOA and then down to each individual hospital.
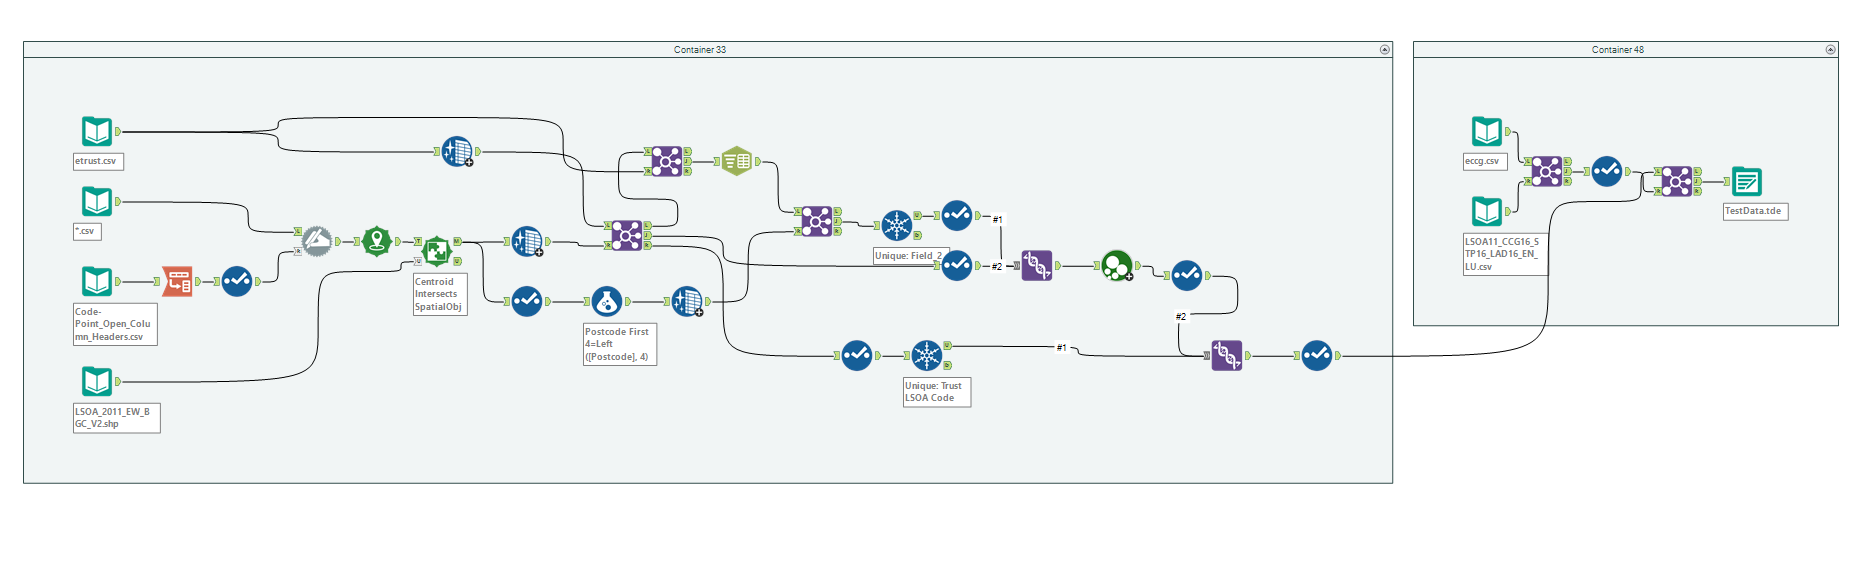
Workflow for NHS Hierarchy
The workflow above shows our way of creating this hierarchy. First of all we load in all the post codes in the UK which also contain their Eastings and Northings. We use the Alteryx Tool “Create Points” to turn these into Spatial Object Centroids. These postcodes are then spatially matched against the LSOAs to provide an LSOA for each postcode. These are then matched against the full list of NHS Trusts via their postcode, there were a few outliers and we matched these to an LSOA via just the first 4 letters of their postcode to provide an approximate match.
The hospitals are then given their Latitude and Longitude using the “Tableau Polygon” tool so if we want to pinpoint their location later on it is a possibility.
The excess LSOAs are then joined back to the data source, these are ones that do not contain a hospital but are still important. This is so if we want to map every LSOA on a chart or filled map then there will be not be blank spaces.
The overarching CCGs and LADs are pulled in from a separate file and they already have the LSOAs assigned to them so we just join them on to each row, giving multiple rows of LSOAs the same CCG/LAD. This is all then output to a tde and we are currently processing this data in tableau along with the previously mentioned demographic and socio-economic data to hopefully provide some insight for our client on Friday. Some of the ideas are to provide “Trade Areas” around each hospital as to track population inside each and then use disease data to see what are the most prevalent.
I will hopefully follow up on this blog post with a further one that shows the vizzes that we create on the back of this data. So far all I can provide is a nice map of the UK, separated by LSOA and coloured by population in each.
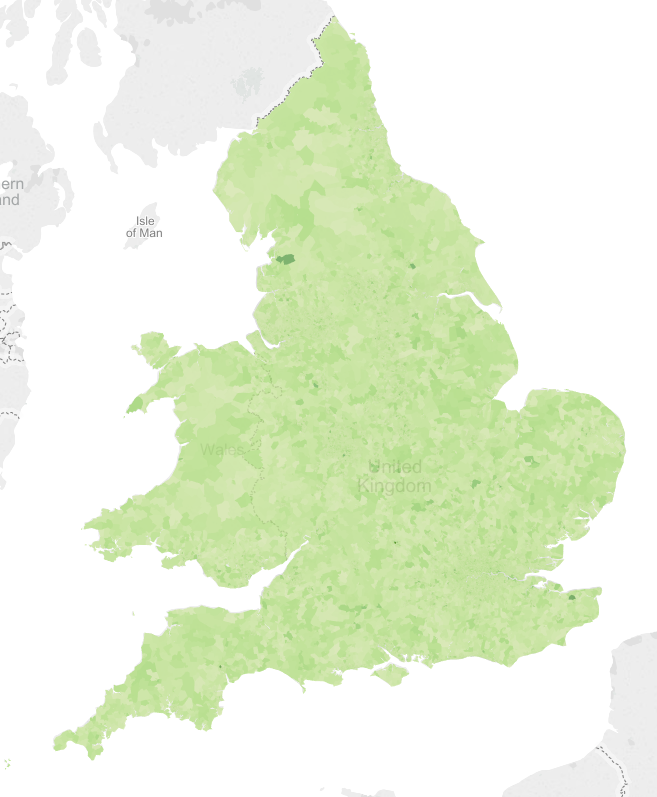
Map of UK with LSOA coloured by population