


Hello, everyone!
As promised, here is my second blog post. Our coaches at the Data School have been pushing us hard – in class and at the pub – and I really can’t believe how much my cohort mates and I have learned in so little time. That being said, let’s dig right in!
Today we’ll be looking at parameters and how you can use them to make some pretty neat forecasts – I’m sure our friends from finance will love this!
Step 1. Setting up
The data we’ll be using is everyone’s favorite dataset – you know it is – Superstore! It’s a standard dataset that comes with every version of Tableau, so head to File>Open>My Tableau Repository, and you’ll find it nested within the DataSources folder. We’re going to be using the Profit and Order Data variables to create a projection of the profit running total that you can customize to your own needs!
The base sheet we will be using can be built using this method:
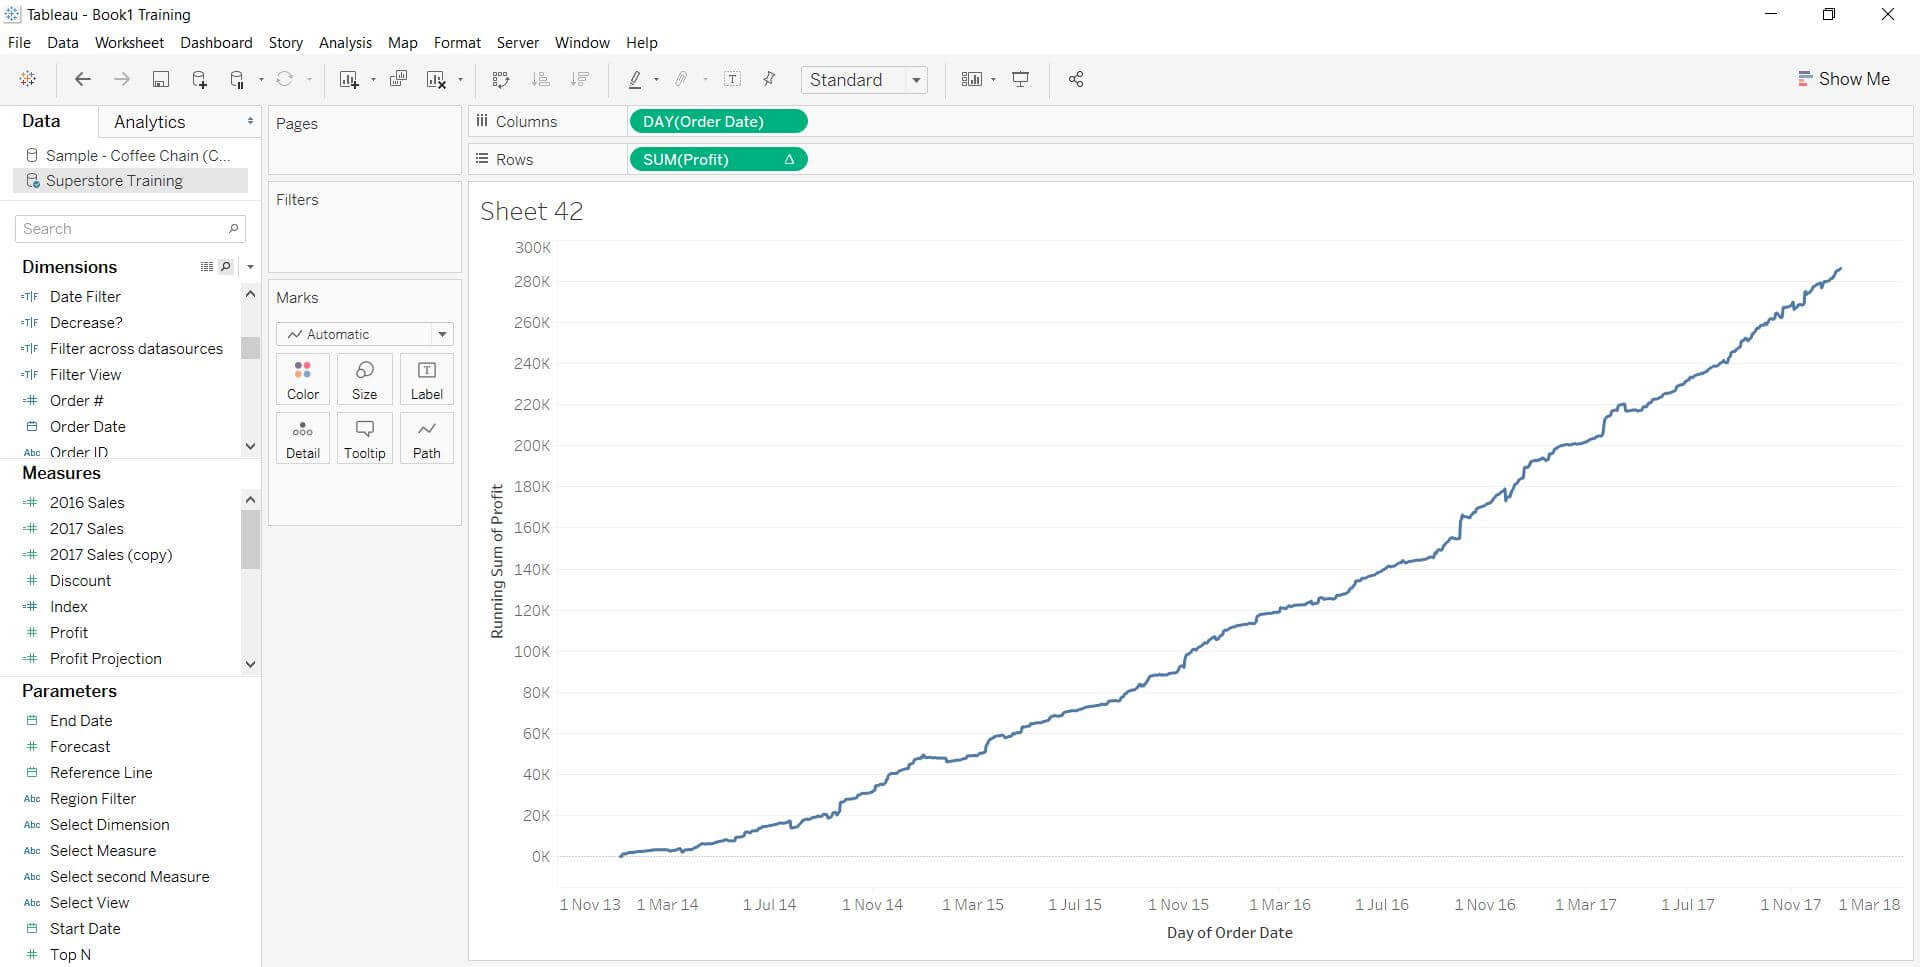
- Drag Profits unto Rows
- Right-click + Drag Order Date into Columns and select the green DAY(ORDER DATE) option.
- Click on the downward facing arrow on theSUM(Profit) in the row shelf, go to Quick Table Calculation, and chose Running Total
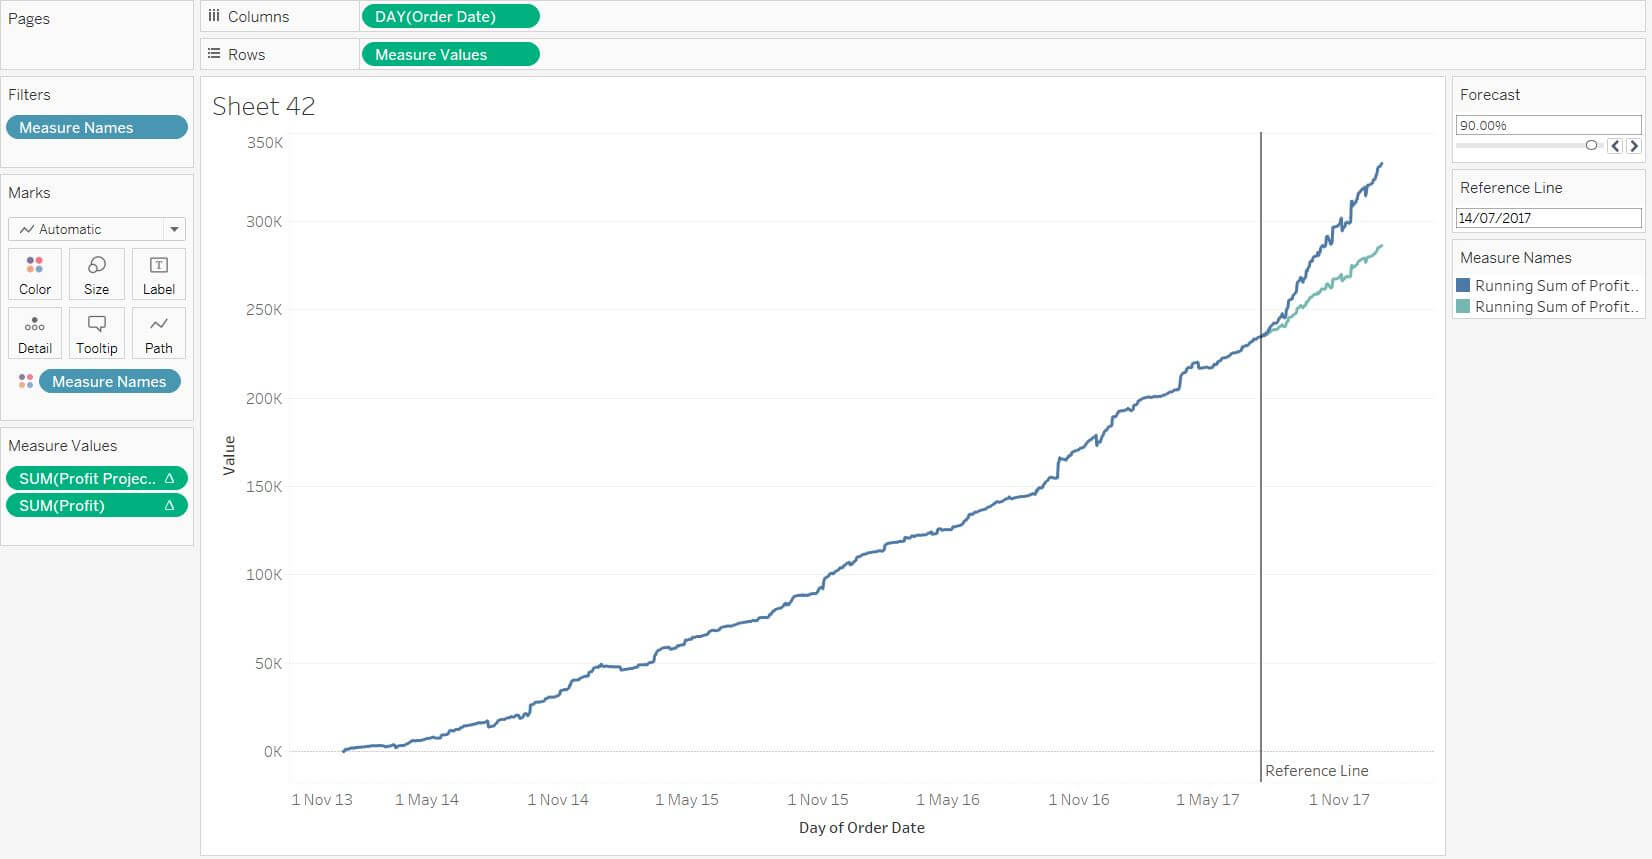
- Voila, your base sheet is ready, and should look like this!
Step 2. Build your parameters!
We’re going to have to build two parameters: One that will allow you to build a reference line on your x-axis that we’ll use to set the date at which the profit projection should start, and another to set up the calculation you’ll need to create the forecast. To build a parameter (don’t get scared, parameters are your friends), hit the downward-facing triangle to the right of Dimensions located in the pane on the left-hand side of your screen. Got it? Great!
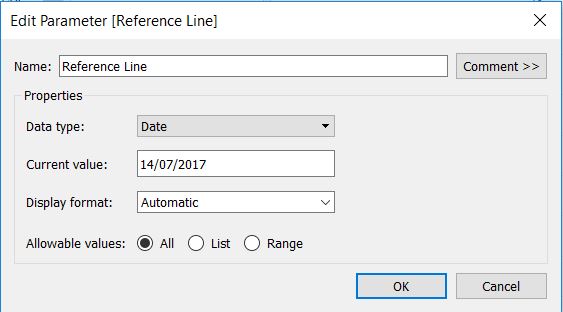
Building the Reference Line:
- Start by giving it a name – I recommend Reference Line to keep things simple
- Set Data Type to Date
- Leave all the other options as is
- Hit Ok
- There you go, not that hard, right?
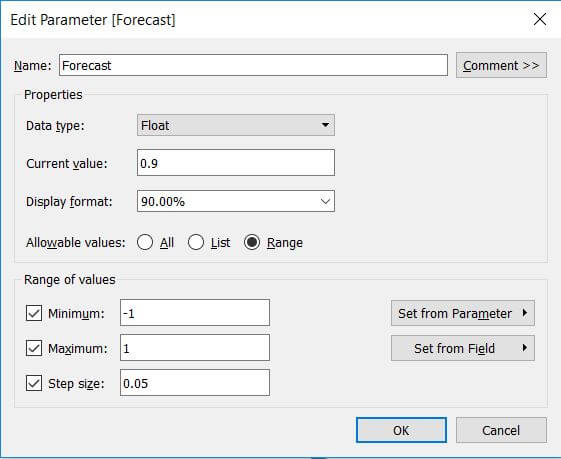
Building the Forecast parameter. This is what we’ll use in our profit forecast calculation later:
- Start by giving it a name – don’t forget to name things!
- Keep the Data Type to the default Float
- Set the Allowable values to Range
- Set the Display format to Percentage
- Set your range of values to:
- Minimum: -1
- Maximum: 1
- Step Size: 0.05
After you’ve built both of them, you’re going to want to Right-Click on them at the bottom left of the main pane in the Parameters category and hit Shower Parameter Control.
Tada, the filters should be there at the top right of your screen!
Step 3. Let’s set up our Reference Line and Profit Forecast
Once again, we’re going to be doing two individuals things here: the first is adding our reference line onto the actual line chart, and the second is building the calculation we’ll use to get our profit forecast.
Adding the Reference Line
- Hit the Analytics button located right next to Data on top of the left pane
- Click and drag Reference Line – you can find it under the Custom List – into the Add a Reference Line pop-up screen that appears
- You’re going to want to drag it to the top left bubble, at the intersection of the DAY(Order Date) row and theTable column.
- On the pop-up screen, you’re going to change the Value option to the reference line parameter you created earlier. Mine is called Reference Lines (Parameters)
- Leave everything else as is, hit okay, and voila! you’ve added a vertical reference line to your x-axis!
- You can manually change the date it is set at using the Reference Line parameter control you added in earlier.

Building your Profit Forecast Calculation
- Once again, you’re going to click on the little downward-facing triangle to the right of Dimensions on the main pane on the left of your screen and hit Create Calculated Field.
- Don’t be afraid of this window, it’s just a simple tool that allows you to link your variables together and get more out of Tableau!
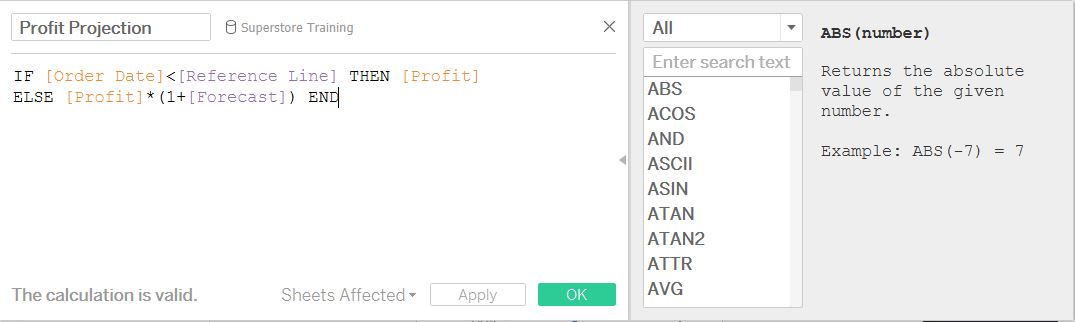
- After naming the calculation – mine is called Profit Projection – you’re going to want to add the following formula:
- IF [Order Date] < [Reference Line] THEN [Profit]
ELSE [Profit] * (1+[Forecast]) END - What does this mean? The first row just means that if the value of the Order Date is earlier than the date you selected for your Reference Line, Tableau should leave it as is and return the relevant Profit value. On the other hand, the second line says that for any date later than the one set for the reference line, then it should calculate the profit forecast.
- IF [Order Date] < [Reference Line] THEN [Profit]
- And voila, you’ve successfully built all the tools you’re going to need to create profit forecasts!
Step 4. Putting it all together and building your profit forecast!
Only a few steps to go!
- Click and drag your new calculation – which you can find inside your Measures on the left pane – into the y-Axis directly. Make it hover onto the Running Sum of Profit axis until a little dashed black box appears and drop it.
- Once you’ve done that, a Measure Values box should appear between the left pane and the line chart. You’re going to right click onto SUM(Profit Projection), hit Quick Table Calculation, and select Running Total.
CONGRATULATIONS!
You have successfully used Parameters, Table Calculations, and a lot of other cool tools to build your very own profit projection. You can use the Parameter Controls at the top-right of the screen to adjust the starting date, and adjust the forecasting parameters according to whatever fits your needs!