Hello, everyone!
After having spent the better part of my day trying to figure out how to run some sentiment analysis in Tableau without having to use Alteryx, I thought it was only normal that I would share my progress with all of you! Sentiment analysis is “the process of computationally identifying and categorizing opinions expressed in a piece of text, especially in order to determine whether the writer’s attitude towards a particular topic, product, etc. is positive, negative, or neutral.” (Thank you, Google Definitions). If you’re looking at this blog post, I assume you already knew that and that you just want to know how to do it. So, let’s dig right in!
1. Download R and RStudio
The sentiment analysis packages we will be used to obtain our sentiment scores are free-to-use and brought to you by the wonderful R community. If you don’t already have the program downloaded, just click right here. I also recommend you get RStudio, it’s pretty much the same as R, just much more user-friendly and easy to work with! You can find that right here.
2. Setting up R
Once you’ve installed R, you’re going to want to do two things. First, set up a Rserve that will allow you to access R’s functionalities from within Tableau, and secondly download the packages we will need to run the sentiment analysis.
For this first part, head into R and copy/paste in the following code:
- install.packages(“Rserve”)
- library(Rserve)
- Rserve()
All this is going to do is download the Rserve package, access it from your computer, and activate it. Once you do, R should prompt you with some text saying “Starting Rserve…”
For this second part, you are going to have to find an install an R sentiment analysis package. There are a few to chose from, including Stanford’s coreNLP, RSentiment, and a few others. I’ve been using a package called ‘syuzhet’ today so that’s the one I will be showing you. To learn more about all the functions this package comes with, read the following documentation. To install the package and load it up, simply do the following:
- install.packages(‘syuzhet’)
- library(syuzhet)
That’s it, you’re done with R for today! Let’s switch to Tableau now.
3. Setting up Rserve in Tableau
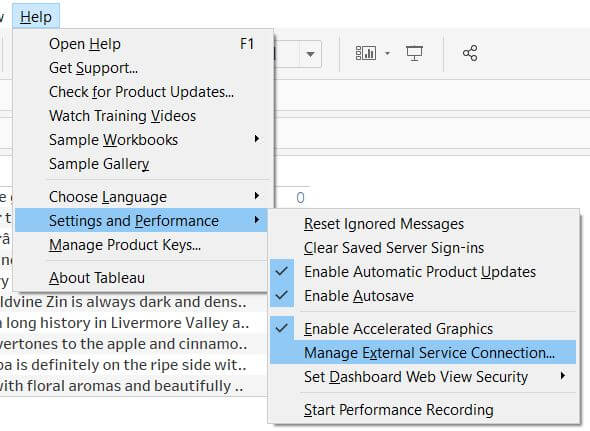
Now that your Rserve is running and you’ve installed your sentiment analysis package, you’re going want to link Tableau to R. To do so, simply head over to Help/Settings and Performance/Manage External Service Connection, as shown in the screenshot below.

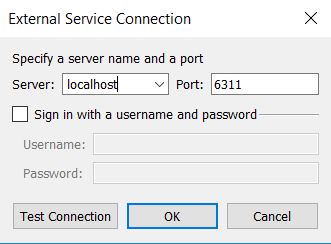
Once you click that, you’ll be prompted with a configuration screen. Just select localhost from the Server drop-down and keep the default Port value.

Hit Test Connection to make sure everything is running smoothly, and that’s it! Tableau can now directly be used to access all of R’s functionalities (or almost all of them).
Step 4. Getting your Sentiment Score
Now that we’re all setup, we’re going to build a calculated field that will use the sentiment package downloaded earlier in R to obtain sentiment scores for the text fields we are interested in our dataset. To do so – considering you are using the same sentiment package as me – simply open up a calculated field and input the following command:
SCRIPT_INT(
“library(syuzhet);
get_sentiment(.arg1, method = ‘syuzhet’, path_to_tagger = NULL)”,
ATTR([Description]))
Let me guide through what this means:
- The SCRIPT_INT function is used to return an integer value from an external service script, R in this case. There is a _BOOL, _STR, and _REAL version of that function, based on the type of value you want to return, and the specification of the function you are using.
- The library() part is telling Alteryx which library to pull the function we are interested in from
- the get_sentiment() is the actual function itself. Please note that .arg1 is what we use to link the R function with your Tableau fields. In this case, .arg1 is the field we need to specify in this R function – the text field we want to analyze – which is then defined by ATTR([description)] at the end. So, if the text variable from the data set you wanted to analyze was called [Reviews], you would keep the syntax exactly the same, and simply replace [Description] by [Reviews] in this code.
Here’s what that looks like in Tableau:

Step 5: Put it all together and be amazed!
After dragging your calculation into the view, R will automatically calculate the sentiment scores for each row of text, and Tableau will build a visualization out of it according to your specifications. Here is what my very basic visualization looks like:

