It’s #DashboardWeek at The Data School. The way this works is I give them a new data set every day and they have to present a dashboard the next morning. This week though, we’re mixing in 90 minutes of training in the morning as well, so that means even less time to build something. Well, it means less time building something in the office and more time building a viz at home.
Our first data set was found by our resident Canadian Nai Louza. She found this AMAZING article about America’s Most Prolific Wall Punchers, which led us to an extensive data set about injuries from the U.S. Consumer Product Safety Commission.
We had only two rules:
- Everyone had to do their own data prep in Alteryx. Any formulas built in Tableau should be pushed back into the Alteryx workflow. This was a nice challenge for me as it forced me to get out of my comfort zone. It was fun asking them a bunch of questions today and I know they enjoyed watching me struggle.
- We had to build a viz in Tableau, preferably one that uses story points.
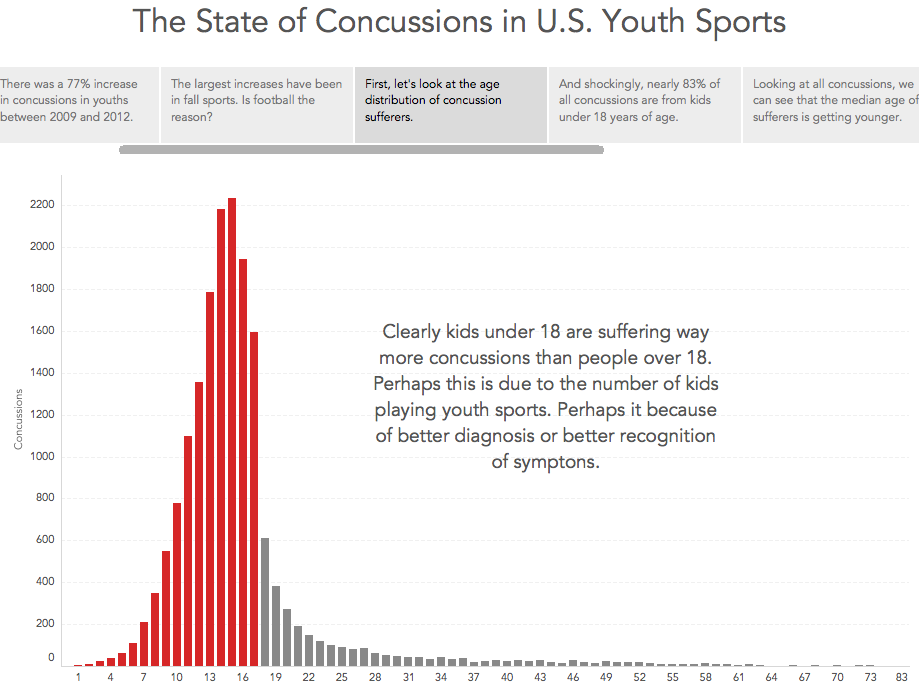
Since my kids are heavily involved in sports, I decided to do a story about concussions in U.S. youth sports. I know from personal experience what concussions are like as a kid. I had three concussion playing American football before I was 15. That might explain a lot.
Click on the image below to view the story, as it goes into much more detail than just this one image. Enjoy!