A trellis chart is a grid where each cell in the grid is the same chart type with the same x- and y-axes but filtered to a different value for some dimension. These can be a useful way to view and compare many values at once.
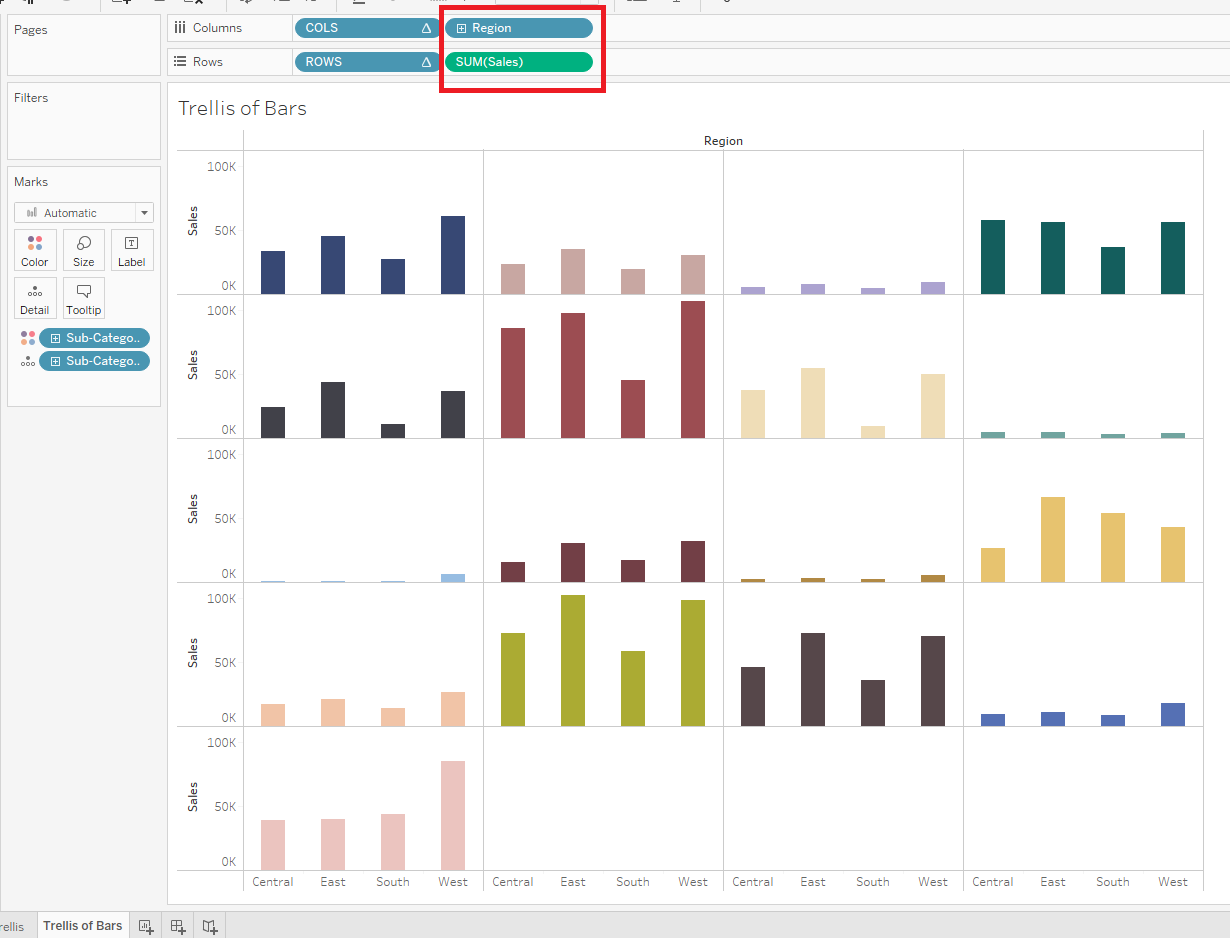
In this tutorial, we will build a grid where each cell is a bar chart of sales per region with each cell showing sales in a sub-category.
Read on to build your trellis of bar charts and find links to further reading to build a other common chart types!

Here's a step-by-step guide using Tableau's built-in Superstore data with screenshots of each step.
Build a Trellis of Bar Charts
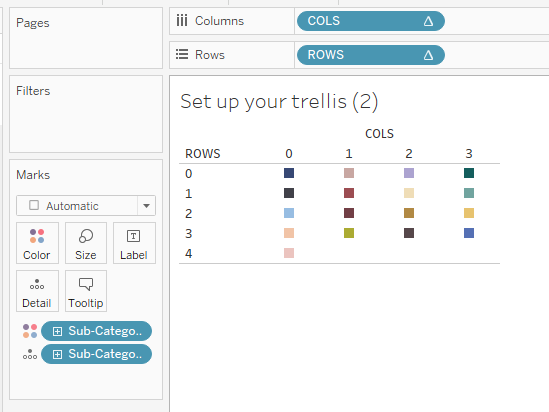
- Set up your trellis.
If you haven't done this already, read my blog: How-To: Set Up a Trellis Chart in Tableau.
- (Optional) Copy your [Breakdown Dimension] onto color.
This can help you ensure your table calcs are configured as desired while building the chart.
- Drag a [Secondary Dimension] onto the "Columns" shelf to the right of the "COLS" pill.
This is the dimension you want to break up each grid cell by, i.e. the dimension for your bars. We will use "Region" as our secondary dimension throughout this tutorial.
- Drag a [Measure] onto the "Rows" shelf to the right of the "ROWS" pill.
This will be the height of your bars. We will use "Sales" as our measure throughout this tutorial.
NOTE: This will create vertical bars. If you want a horizontal bar chart instead, put your [Measure] on the "Columns" shelf and your [Secondary Dimension] onto the "Rows" shelf.
- Format your bar chart as desired.
In this case, no updates to the table calcs were needed.
Voila! You've created a trellis of bar charts!
Add other chart types to your trellis using my How-Tos:
- How-To: Set Up a Trellis Chart in Tableau.
- How-To: Build a Trellis of Donut Charts in Tableau
- How-To: Build a Trellis of Line Charts in Tableau
See all these charts in action with embedded How-Tos here: