


In my last post I talked about about spatial data in Alteryx and leveraging Alteryx to do spatial analytics. Now if we want to visualise spatial information in Tableau we need to re-organise our data to make it suitable for importing. Tableau doesn’t have spatial objects as a field type like Alteryx does, instead it relies on longitudes and latitudes as direct inputs. In this post I’ll run through a quick example of turning Alteryx lines into paths on Tableau.
Spatial Objects to X & Y
My example starts with a map input that has two polylines showing my most commonly travelled routes. One from my hockey club to our pitches in the Olympic park and the other my cycling route from home to the Data School. The first step is using a tool called Poly-Split, it has an option to convert my Alteryx Lines into a series of points. As it does this it will also number them in sequential order which is needed to rebuild the line later. The configuration box on the right hand side displays other options for splitting spatial objects though those options all pertain to polygons rather than lines.
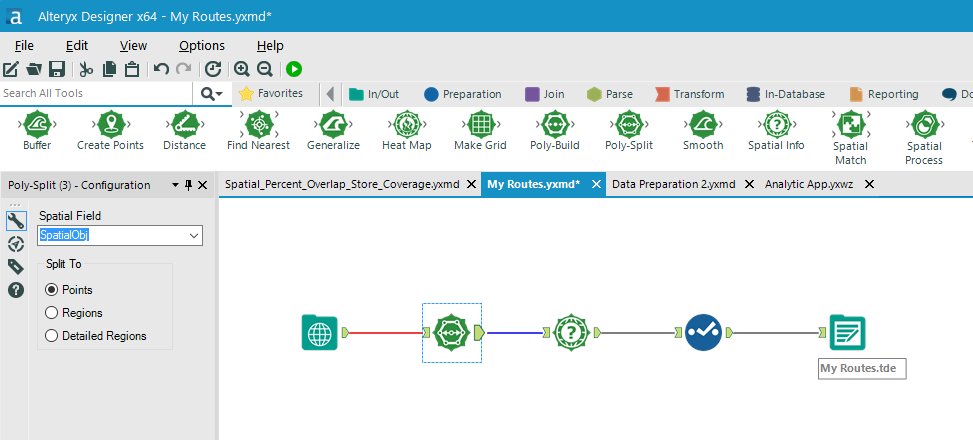
Poly-Split in my Workflow
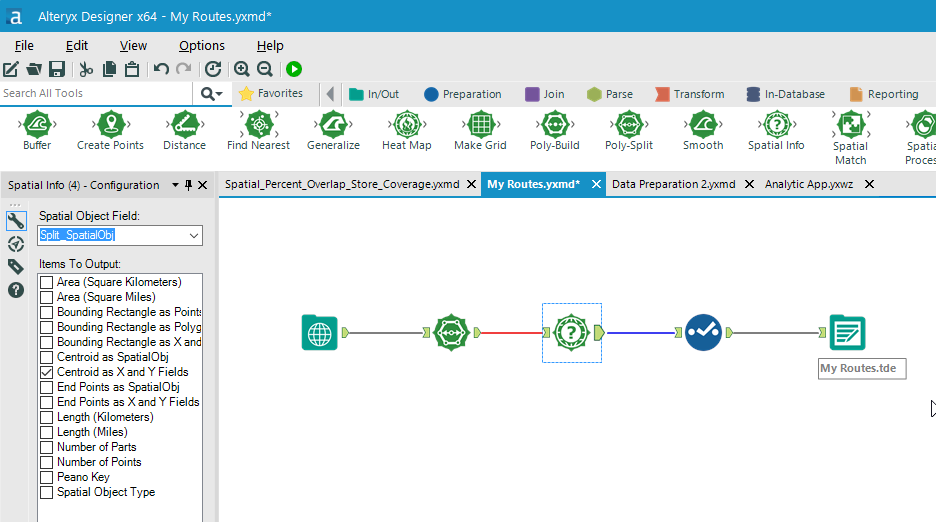
The next tool to use is Spatial Info, this allows us to output information about each of our spatial objects and in this case we want the point centroids as X and Y fields. These X and Y fields will be longitude and latitude respectively. I then renamed some columns with a select tool and exported them to a .tde file ready for importing to Tableau.
Tableau
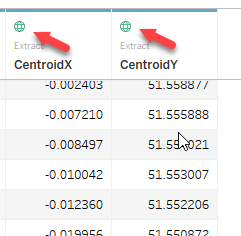
In Tableau the first step is to make sure that the Longitudinal and Latitudinal fields are read correctly as geographic data fields. If they are not you can click on “#” or “abc” and change the field types.
In the worksheet, if we add our X and Y data into columns and rows, make our marks a Line, “Split_SequenceNum” into Path and then “Label” into Text or Detail then we very quickly populate the map with our lines. “Split_SequenceNum” into Path is important so that the lines are connected in the correct order otherwise Tableau will automatically create the shortest route between the points.
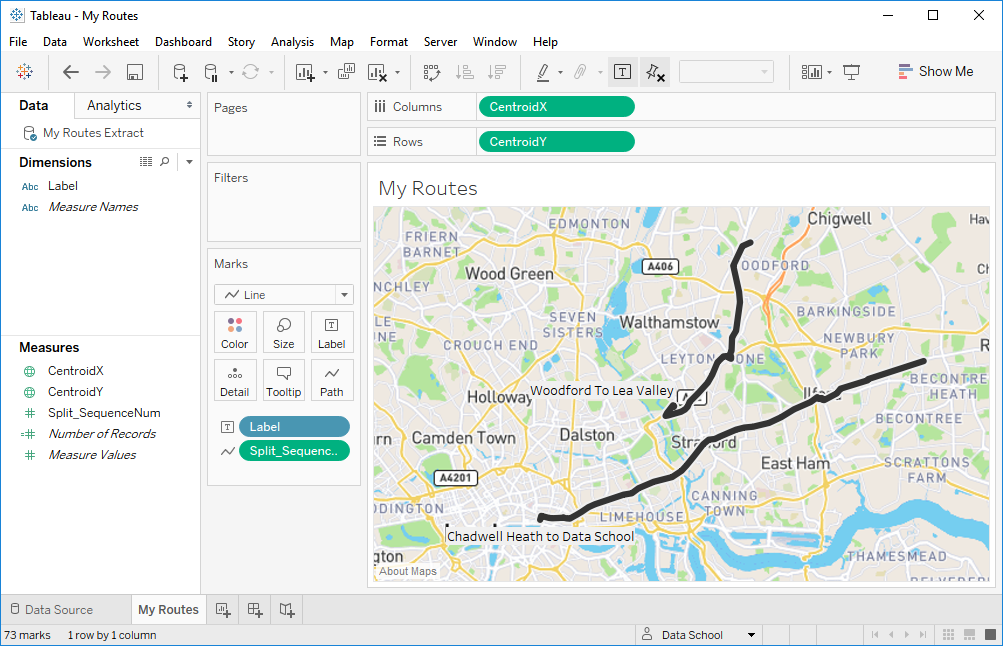
Our quick Tableau Dashboard
And just like that in five Alteryx tools and four drag and drops in Tableau we have our routes mapped out.