Last weekend I read an interesting article (https://www.nytimes.com/interactive/2017/06/23/opinion/trumps-lies.html?smid=tw-nytimes&smtyp=cur) on the lies Donald Trump said in his first 4 months in office.
The first section of the article documents the date of each lie and the truth associated with it. Directly after this information, the article has a calendar to demonstrate the date of each lie. Upon viewing, I wondered why this section of the article wasn’t an interactive calendar. Therefore, I decided to it would be good practice to try and achieve this idea in Tableau after scraping the information from the site.
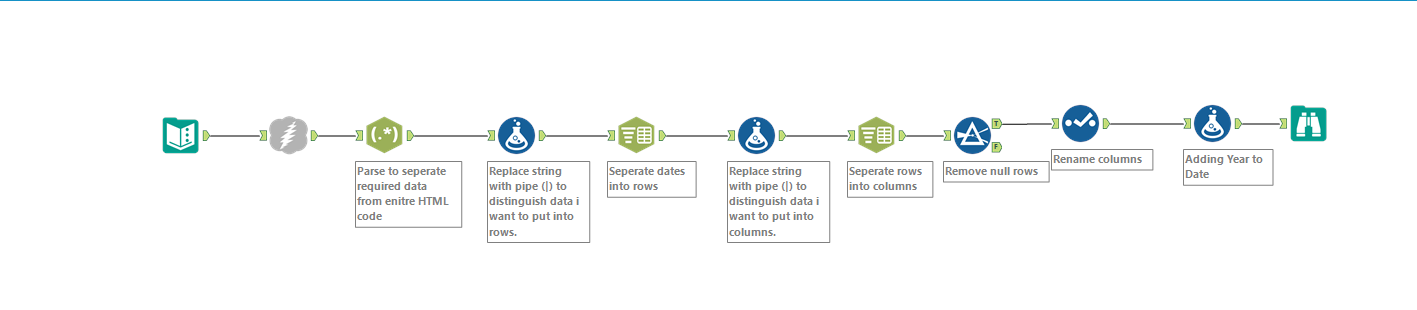
This blog will document the first part of creating the visualisation – the initial scraping and cleaning of the data in Alteryx. Here’s a screenshot of the workflow I used to create a readable table followed by a brief explanation of the key steps.
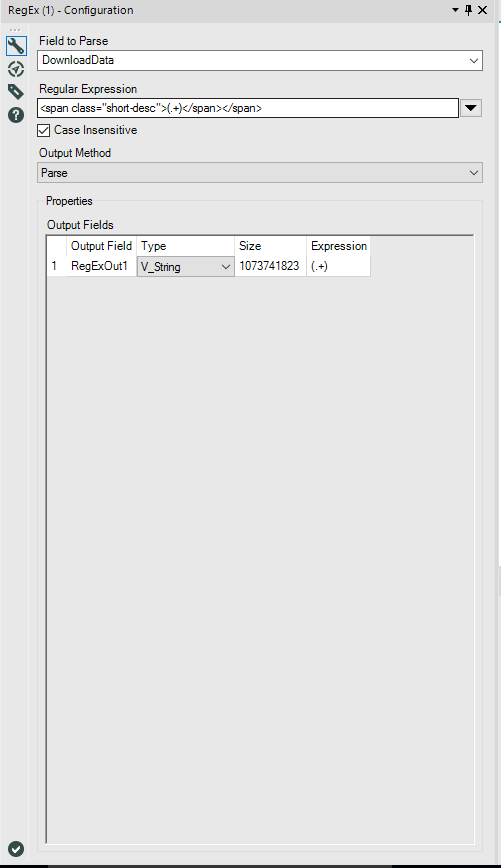
The first key step was to parse the downloaded html, with regex, to leave me with a string that contains the data required. To do this I found unique expressions at the start and the end of the data section. These were <span class=”short-desc”> and </span></span>. Here’s a screenshot showing the process.
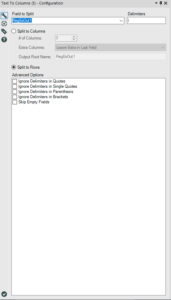
I was now left with a long string that needed to be moved into rows and columns. This was achieved by first using a formula to replace unique string’s with pipes (|). To distinguish rows, I swapped <strong> and </span></span><span class=”short-desc”> with pipes and then used the pipes as a delimiter in text to columns as shown below.
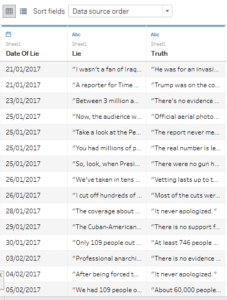
The final staged of this workflow was to ensure the data was readable by tableau. Filter, select and formula were used to remove nulls, rename columns and add the date. This left me with the usable file beneath.