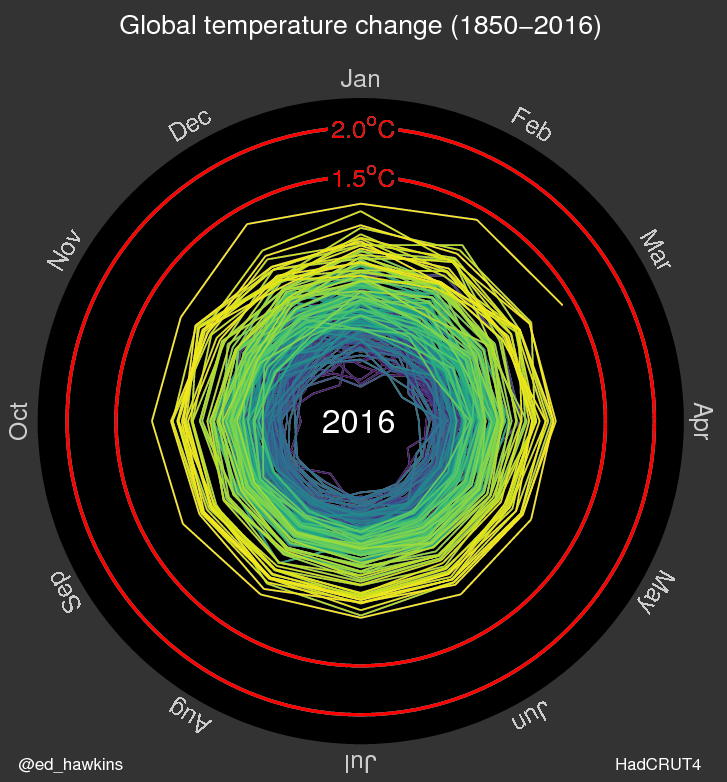
Life at The Data School (version 4.0) started in earnest yesterday, with a flurry of donuts, coffee, crayons and nervous grins. Today was Day 2 and after some initial Tableau training we launched straight into a #MakeoverMonday. The challenge was to re-imagine Ed Hawkin’s visualisation of global temperature change.
I was struck initially by the fantastic visual impact of how the data was represented – the colours and pattern deliver a strong statement about how temperatures have increased since 1850. The viz is animated so as to show each year on year difference from January 1850 – March 2016, relative to the mean of 1850-1900. The data was taken from HadCRUT4.4 (available here).
My re-imagining of the visualisation was inspired by the spiral design of the original viz. Whilst at university I heard an amazing lecture about one of my all time favourite novels – One Hundred Years of Solitude by Gabriel García Márquez. The lecture impressed upon us that the best (and indeed most effective) way to get to grips with the confusing story line in the book was to imagine the concept of time as a spiral rather than linear. For my first ever DS4 viz I decided to reverse this idea and instead try to unravel the spiral of the original visualisation back into linear form, in two ways. The first was to take the median temperature change and plot each individual day as a line graph in order to illustrate the apparent upward trend of global warming. The second part of the viz is a Gantt Bar showing the same information but in a different format – here you are able to distinctly recognise each individual day’s temperature by colour. The idea was to keep the viz as simple and clean as possible.

