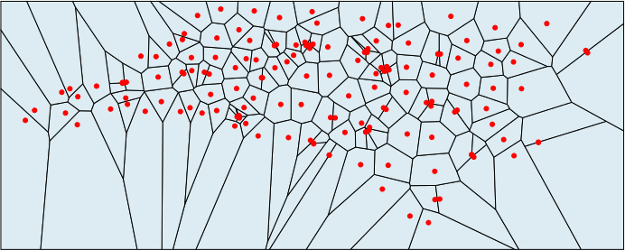
In mathematics, a Voronoi diagram is a partitioning of a plane into regions based on distance to points in a specific subset of the plane. That set of points (called seeds, sites, or generators) is specified beforehand, and for each seed there is a corresponding region consisting of all points closer to that seed than to any other. These regions are called Voronoi cells.
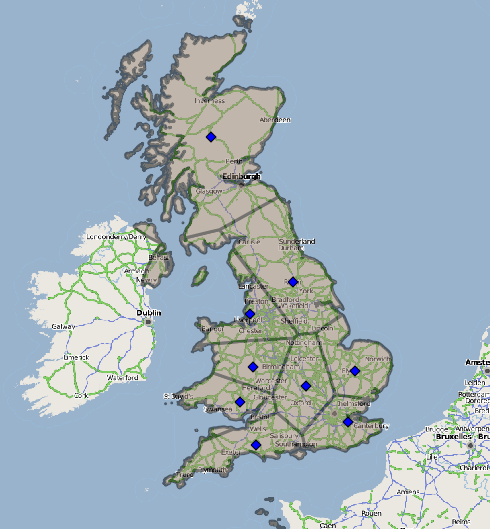
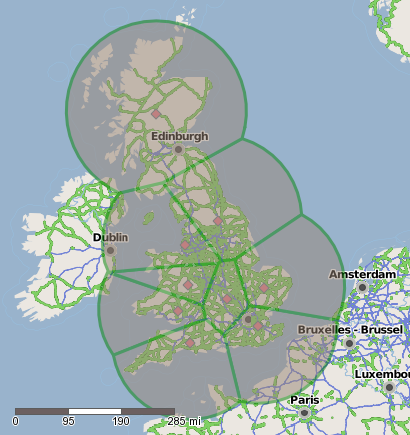
One of the earlier methods that I tried to use to solve our client issue last week was to create a Voronoi diagram of the UK. This would be using the sales people as the seeds and therefore their Voronoi cell would be their sales area.
Simple Voronoi
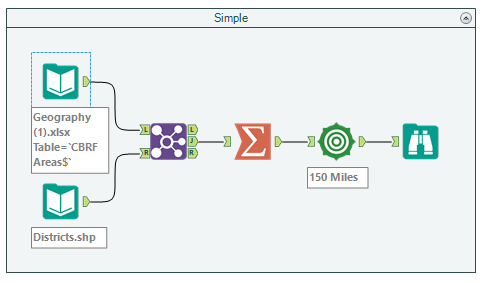
Simple Voronoi Workflow
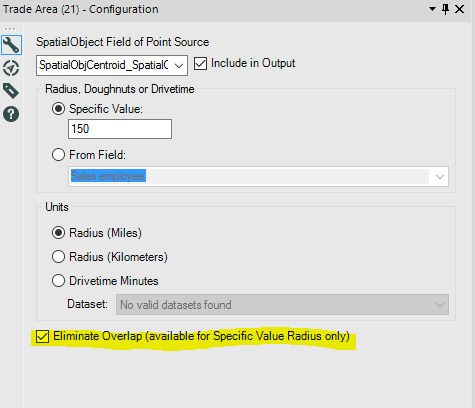
To create a very simple Voronoi in Alteryx is fairly simple, all we need is a set of centroids to use as our seed and the rest can be created using Alteryx tools. In the workflow above I join a list of Sales people with a shape file that contains postcode areas. These are then summarized using the process of “Spatial > Create Centroid” to create a Centroid of each person. We then create a trade area around each person, I have chosen 150 miles purely on the basis that the resulting trade area polygons will cover the whole of the UK. This is also the part where the Voronoi is created, the check box “Eliminate Overlap” must be checked to create the Voronoi cells.
Advanced Voronoi
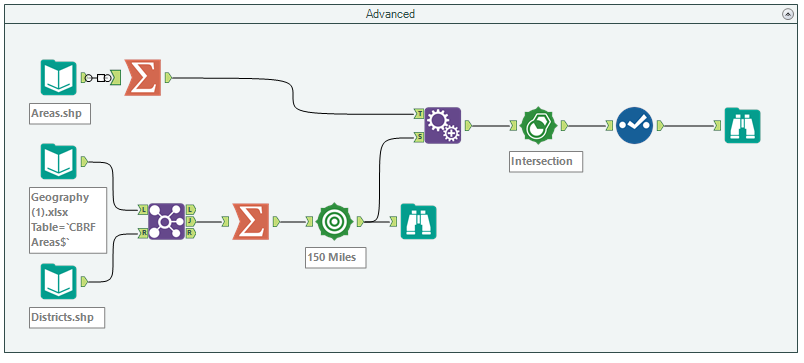
Advanced Voronoi Workflow
Whilst the above Voronoi diagram works in principle it is hard to determine the real world areas that each cell covers as the vast majority of each is covering the sea! What I wanted to achieve was to be able to cut out each cell from the borders of the UK. To do this we must first create a shape file that we can cut out from, aka a shapefile that is just the UK. To do this I just combined all the polygons inside a postcode shape file to create one large polygon covering the whole of the UK. I then appended this to my previous list of voronoi cells. What we use next is a “Spatial Process” tool, we use this on the “Create Intersection Object” function. This will produce a new Spatial Object for each employee that is the intersection between their original Voronoi Cell and the map of the UK. The result is a much neater, and usable Voronoi diagram: