


Hello, everyone!
This week at the Data School has been dedicated entirely to picking apart all of Tableau’s advanced functions. From figuring out all the neat little ways to get the most out of table calculations to building ridiculous nested if statements with level of detail calculations, Andy’s lectures have been as enlightening as they’ve been challenging. Today’s guide, however, is dedicated to a simple yet powerful chart type: the histogram.
The histogram is a diagram consisting of rectangles whose area is proportional to the frequency of a variable and whose width is equal to the class interval. In other words, they show the distribution of your data by diving it into bins of equal size and assigning each bin a bar that is proportional to the number of data points that fit within that bin. What’s even cooler about Tableau’s functionalities when it comes to histograms is the ability to dynamically change the bin size through the use of parameters. Yes! No need to recreate a new chart if you want to drill down further into the distribution of your data, or aggregate up, you can simply us the slider on your parameter control. With all of this in mind, let’s get into the thick of it: How do you make this chart anyways?
In today’s Tableau guide, I’ll be using some natality data that gives information on the total number of births, the average age of their mothers, etc. Our objectives will be to create a histogram that shows the distribution of the average birth weight.
Step 1: Building your bins
In order to build our histogram, our first step is going to build our bins within which our data points will then be distributed.
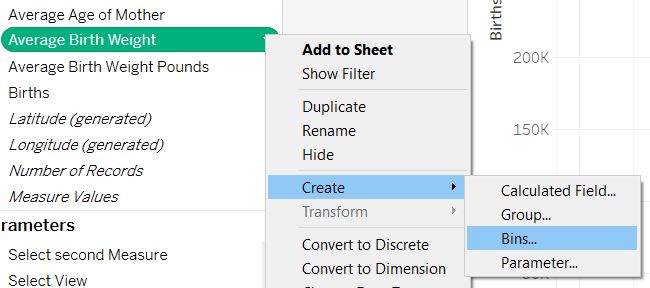
- This step is as simple as it gets: Click on the little caret of your Measure of interest in your data pane – mine is Average Birth Weight Pounds – scroll down to the Create option, and select Bins.
Step 2: Setting up your parameter control
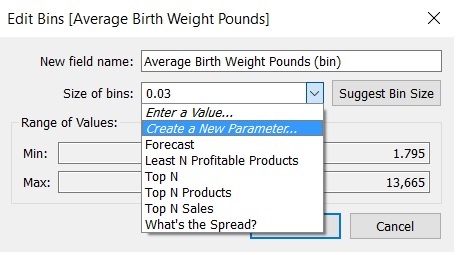
- After you’ve hit Bins, you’ll be prompted with a configuration window. All you’re going to want to do is click on the Size of Bins menu and select Create a New Parameter.
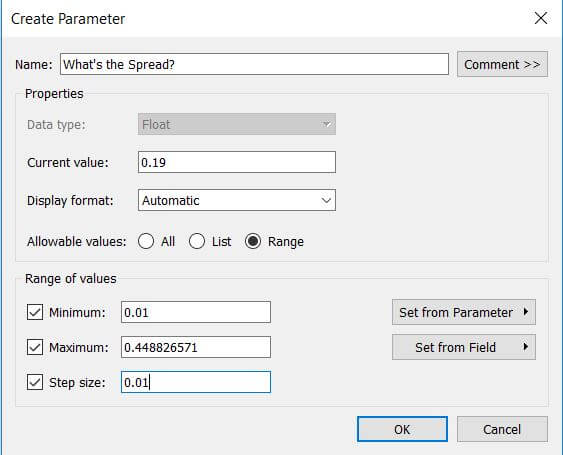
- Once you’ve hit Create a New Parameter, you’ll be prompted with another configuration window. You can leave all the prepopulated values – Tableau will estimate what the minimum, maximum, and step size should be – or adjust them to your own liking. I am going change the minimum value and step size to 0.01 and leave the maximum value as is. This means that the user of my dashboard will be able to use the parameter control to adjust the size bins in increments of 0.01, with a minimum size of 0.01 and a maximum size of 0.449.
- Remember to give your parameter a name so your future user can easily understand what he is adjusting when he plays around with the slider!
- Hit okay, and you should see your parameter control appear on the top-right of your screen. You can hover over it, hit the little caret, and change the display option to Slider for extra usability and clarity. It should end up looking like this:
Step 3: Putting it all together!
Now that you’ve setup your bins and configured your parameter control, you’re ready to build your histogram!
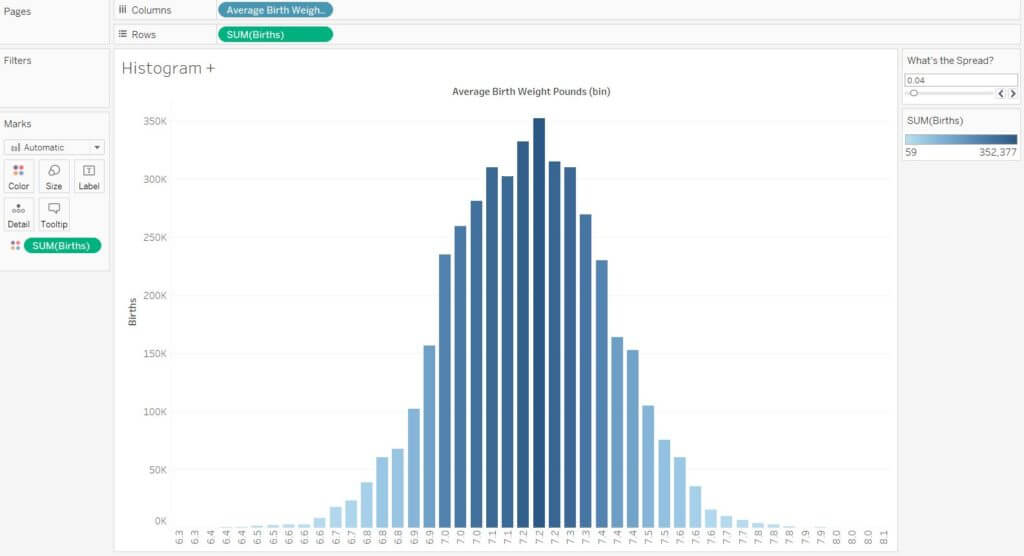
- Drag your key measure into Rows – mine is Births – and the bins Dimension unto columns – mine is called Average Birth Weight Bins.
- You can drag your key measure unto Color in the marks card to add some additional visual information and show your viewer where the majority of your datapoints are concentrated.
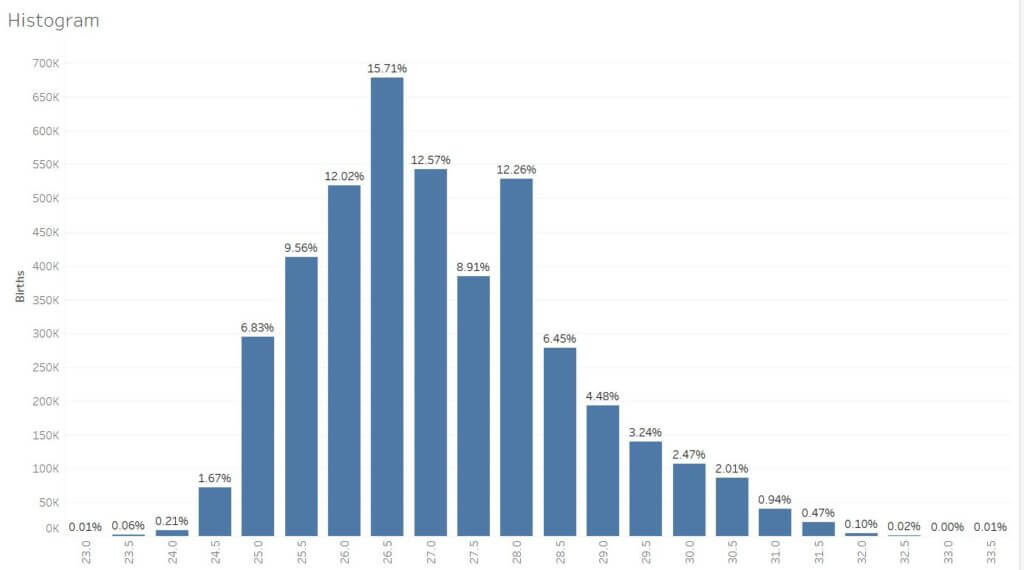
- Voila! You should be looking at a histogram that looks like this!
Congratulations! You’ve successfully built your first histogram, and you now have another chart type under your belt you can use to build interesting stories from your data. Tune in next time for more tips and tricks!