


Well from the title alone it is obvious that something has gone terribly wrong today. Just for the record, the time is 4:48 pm GMT and I have just started writing this blog.
(Note : all the times in brackets refer to the actual time when I was writing the blog; just to see how far off I will be)
Obviously, this is not the way to success nor glory and you my dear reader has just been warned for what is to follow. If you anticipate to see a beautiful dashboard, this is not the blog for it. However, it’s a very nice way for me to record what has gone wrong today and probably not make the same mistakes tomorrow (4:50 pm GMT).
The task
We’ve been tasked to analyse data collected by the Environmental Protection Agency (EPA) in the US about facilities or sites subject to environmental regulations. You can find the datasets in the following link .
Essentially, these are 10 different datasets containing at least 1,000,000 rows each. To understand the meaning of the different fields, you must first read the documentation, on which I reckon I ‘ve spent more time than I should. Anyway, it was a very good challenge and I really enjoyed the data preparation part, so special thanks to our fellow DSers Soha Elghany and Ellie Mason (4:58 GMT, obviously I’m not gonna make it till 5pm).
The Data Prep
As I mentioned before I really enjoyed the data prep part; hence I spent most of my time on it. Bringing together four out of ten datasets, I managed to explore a fair bit of the data in Alteryx. I even had the time to use some reporting tools before exporting my final hyper file in Tableau (5:05 GMT)

Another hurdle in today’s challenge was also the immense amount of time waiting for the alteryx workflow to run, then caching & re-running then waiting some more. I believe I created the final export at 3:55 pm and I remember not feeling 100% confident about what I was exporting. Maybe deciding which of the 51 states I was going to use at an earlier stage would have saved me (some) time rather than trying to export all of them.
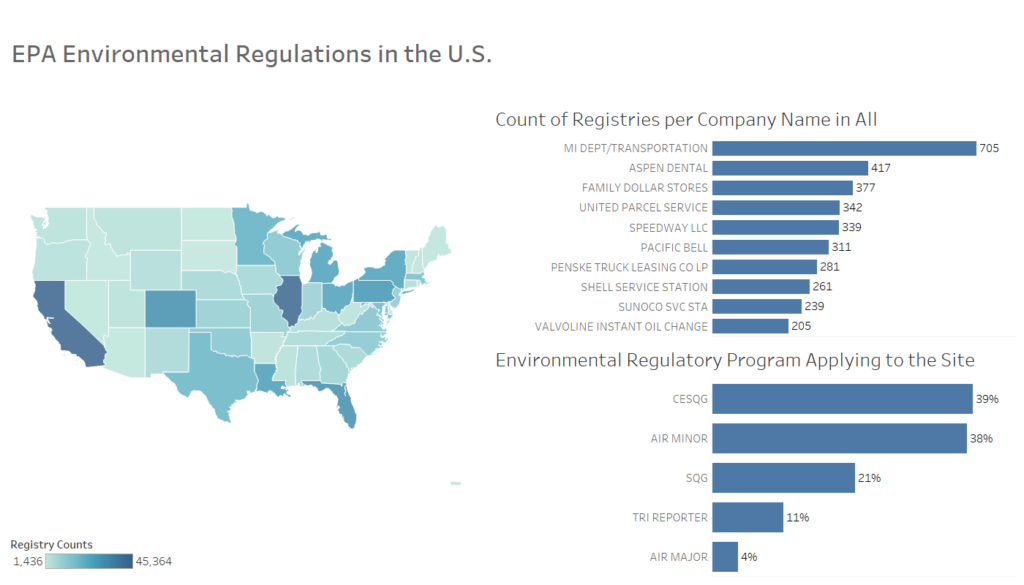
And now….behold the dashboard!
My worries were confirmed a few moments later. After spending so much time in Alteryx preparing, formatting and cleansing the data, I ended up in Tableau with no idea of what I wanted to visualise. Hence, I thought that Rome was not built in a day (so my dashboard could not be great in 30 minutes) and I should keep it simple… Tableau superstore for Beginners training simple (5:15 GMT).
If you would like to see this amazing dashboard and explore it on your own, you can find it in my Tableau Public profile.
Things to do tomorrow :
- Actually make and stick to the schedule,
- If you see that something does not work, please move on. It’s never going to be perfect,
- See above.
5:25 pm…. finished the blog. No proof reading, so I apologise for all the mistakes I’ve made. Hopefully, tomorrow is going to be a different day.