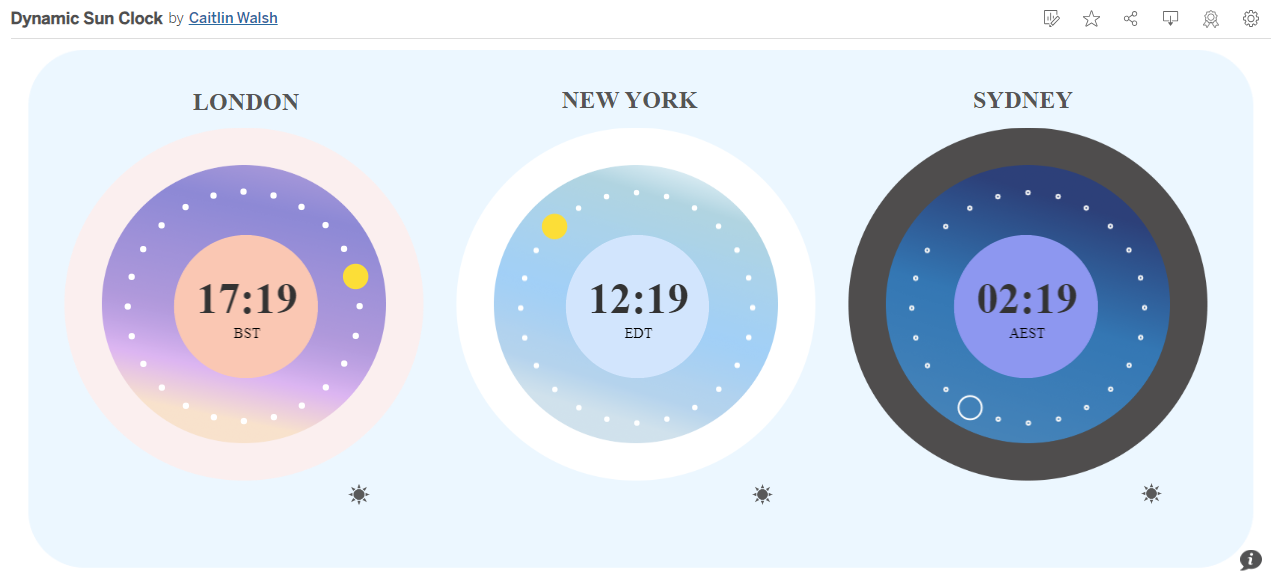
I recently published a viz to Tableau Public that made the most of the recently added Dynamic Zone Visibility feature, by checking for the time of day and replacing some of the background visuals and chart colours depending on whether it was daytime, nighttime, sunrise or sunset.
While working on this in Tableau Desktop, I did not notice any issues: my workbook locale was set to English (United Kingdom), and the correct time of day was displayed when I used the NOW() function to return the current hour and minute.
However, as soon as I published to Tableau Public, I noticed that my clock was an hour out. Some digging revealed that the Tableau Public site is most likely using UTC: even though I am in British Summer Time at the time of writing this (i.e. UTC +1), Tableau Public was showing Greenwich Mean Time (i.e. UTC).
I figured I could add some simple logic to check when opening the viz whether that extra hour should be added or not; however, I was using a very simple dataset to construct my viz, and it did not contain any continuous datetime fields.
Without scaffolding my dataset or hardcoding the start and end of BST, is there another way to work out whether or not today's date is in the Daylight Savings period?
British Summer Time rules
Most Daylight Savings time rules are based on a certain week of a certain month in the year.
In the UK, the British Summer Time period when the clocks move forward one hour - to reflect the fact that there is more daylight in the evenings and less in the mornings - starts on the last Sunday of March.
We then adjust the clocks again and return to Greenwich Meantime when there is less daylight in the evenings, on the last Sunday of October.
If I were to open a Tableau workbook on the day of writing this blog (25th September 2023), I would want to be able to create logic in Tableau that works out the BST dates for the current year, and then check whether or not today falls within that range, adding an hour if True.
N.B. This blog will not take into account the exact hour of the clocks moving forward/back, but will simply work on the assumption that on the day of the change, any modifications are in place for the entire day.
Logic in Tableau
We can follow a series of steps in Tableau to dynamically return the dates for the last Sundays in March and October each year.
Starting with the last Sunday in March, let's first establish the day of the week for the first day in April; once we know this, we can then work backwards to the most recent Sunday at that point in time.
We can use the function DATETRUNC(date_part, date) with the date part 'month' to return the first day of a month. Using TODAY() for the date would return #2023-09-01#.
Since we want to always show the first of April, for our date in this function we can use DATEADD(date_part, interval, date), where the integer is the difference between our current month (e.g. 9) and the month of April (4).
The first building block of our calculation will therefore look like this:
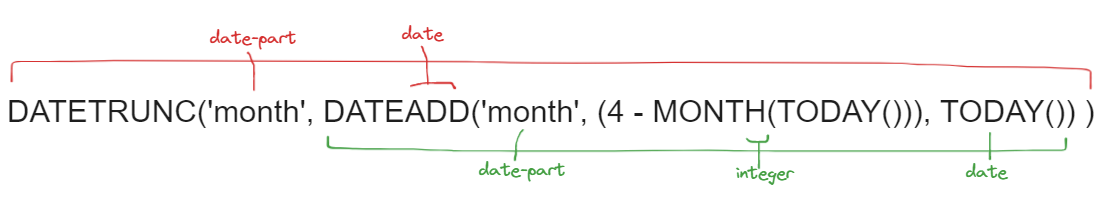
I'll refer to this as our 'April Start' for now, for brevity in the next few calcs.
From here, we can focus on the day of the week, and find the date of the next available Sunday (i.e. the first Sunday in April).
We can use another DATEADD here, but this time we will use ISOWEEKDAY to create our integer in this calculation, and work out the difference between our current weekday (e.g. Monday = 1) and the next Sunday (7):
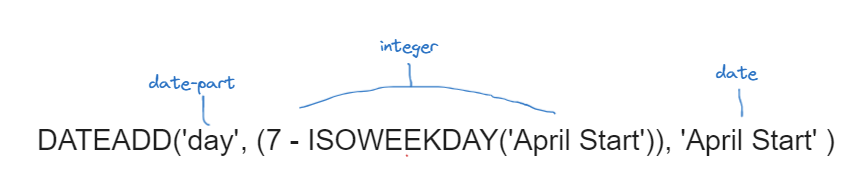
The output of this calculation when I display in in Tableau today is #2023-04-02#, the first Sunday in April 2023.
All I now need to do to find the last Sunday in March is use one more DATEADD, this time subtracting exactly one week from this date.
The final calculation in Tableau for finding the start of British Summer Time is as follows:
DATEADD('week', -1,
(
DATEADD('day',
(7 - ISOWEEKDAY(DATETRUNC('month', DATEADD('month', (4 - MONTH(TODAY())), TODAY()) ))),
DATETRUNC('month', DATEADD('month', (4 - MONTH(TODAY())), TODAY()) )
)
)
If we want to find the end date for BST, the calculation will be the same, but will be based around the start of October in place of April:
DATEADD('week', -1,
(
DATEADD('day', (7 - ISOWEEKDAY(DATETRUNC('month', DATEADD('month', (11 - MONTH(TODAY())), TODAY()) ))),
DATETRUNC('month', DATEADD('month', (11 - MONTH(TODAY())), TODAY()) ))
)
)
Bonus examples
Eastern Daylight Time (EDT) starts on the second Sunday of March:
DATEADD('week', 1,
(
DATEADD('day', (7 - ISOWEEKDAY(DATETRUNC('month', DATEADD('month', (3 - MONTH(TODAY())), TODAY()) ))),
DATETRUNC('month', DATEADD('month', (3 - MONTH(TODAY())), TODAY()) )
)
)
)
...and ends on the first Sunday in November:
(
DATEADD('day', (7 - ISOWEEKDAY(DATETRUNC('month', DATEADD('month', (11 - MONTH(TODAY())), TODAY()) ))),
DATETRUNC('month', DATEADD('month', (11 - MONTH(TODAY())), TODAY()) )
)
)
You can view my viz that puts these principles to use here