Hi all, and welcome to Dashboard Week for DS26 and 27! Our challenge today was given to us by Carl. That challenge was to use this dataset on UK fishing - https://www.gov.uk/government/publications/salmonid-and-freshwater-fisheries-statistics-2019/salmonid-and-fisheries-statistics-for-england-and-wales-2019#river-catch-summaries-by-area - specifically section 5 - which covers rod and net fishing for both Salmon and Trout. So - let's go through step by step and see how I manipulated the data, experimented (a lot) and the final outcome.
Part 1 - Making the data useable in Tableau
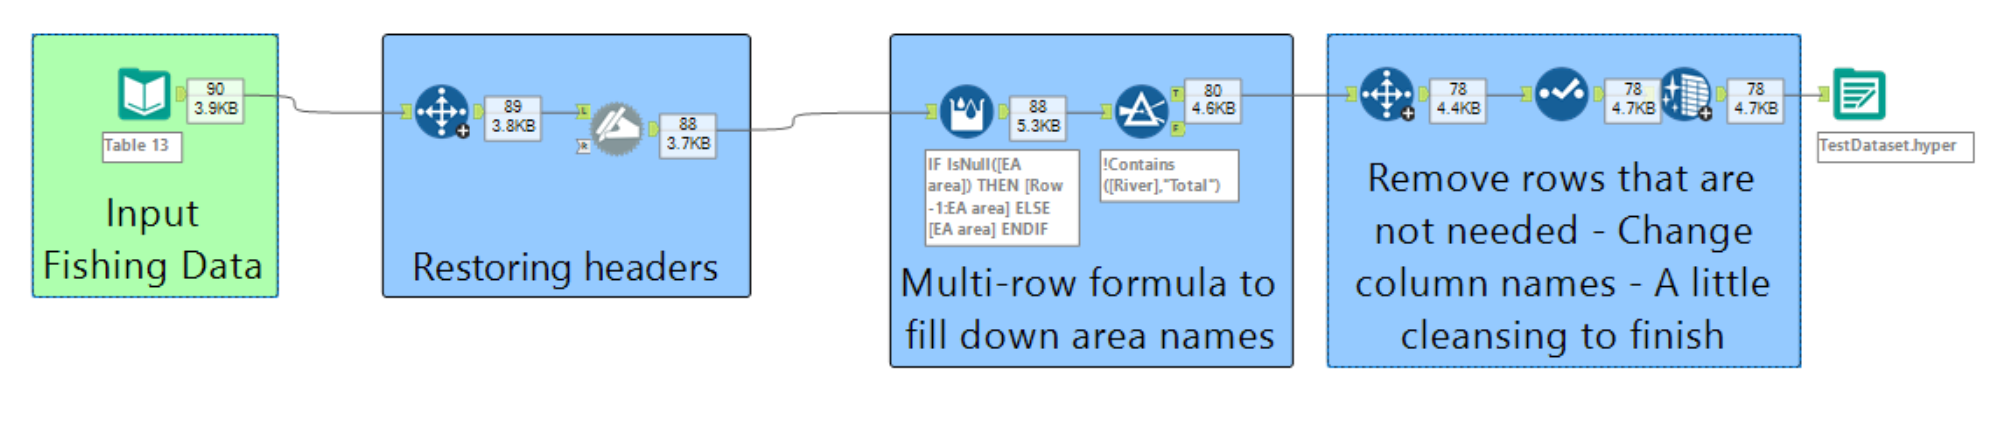
Luckily for us all, the government provide all their data tables in a csv format - so it's nice and easy to access and download - however, that data needs a lot of cleaning - for this I decided to use Alteryx - as a quick look at the data in Excel showed me I had to use a multi-row formula to fill down those columns. This is unfortunately something that programs such as Tableau Prep cannot do.

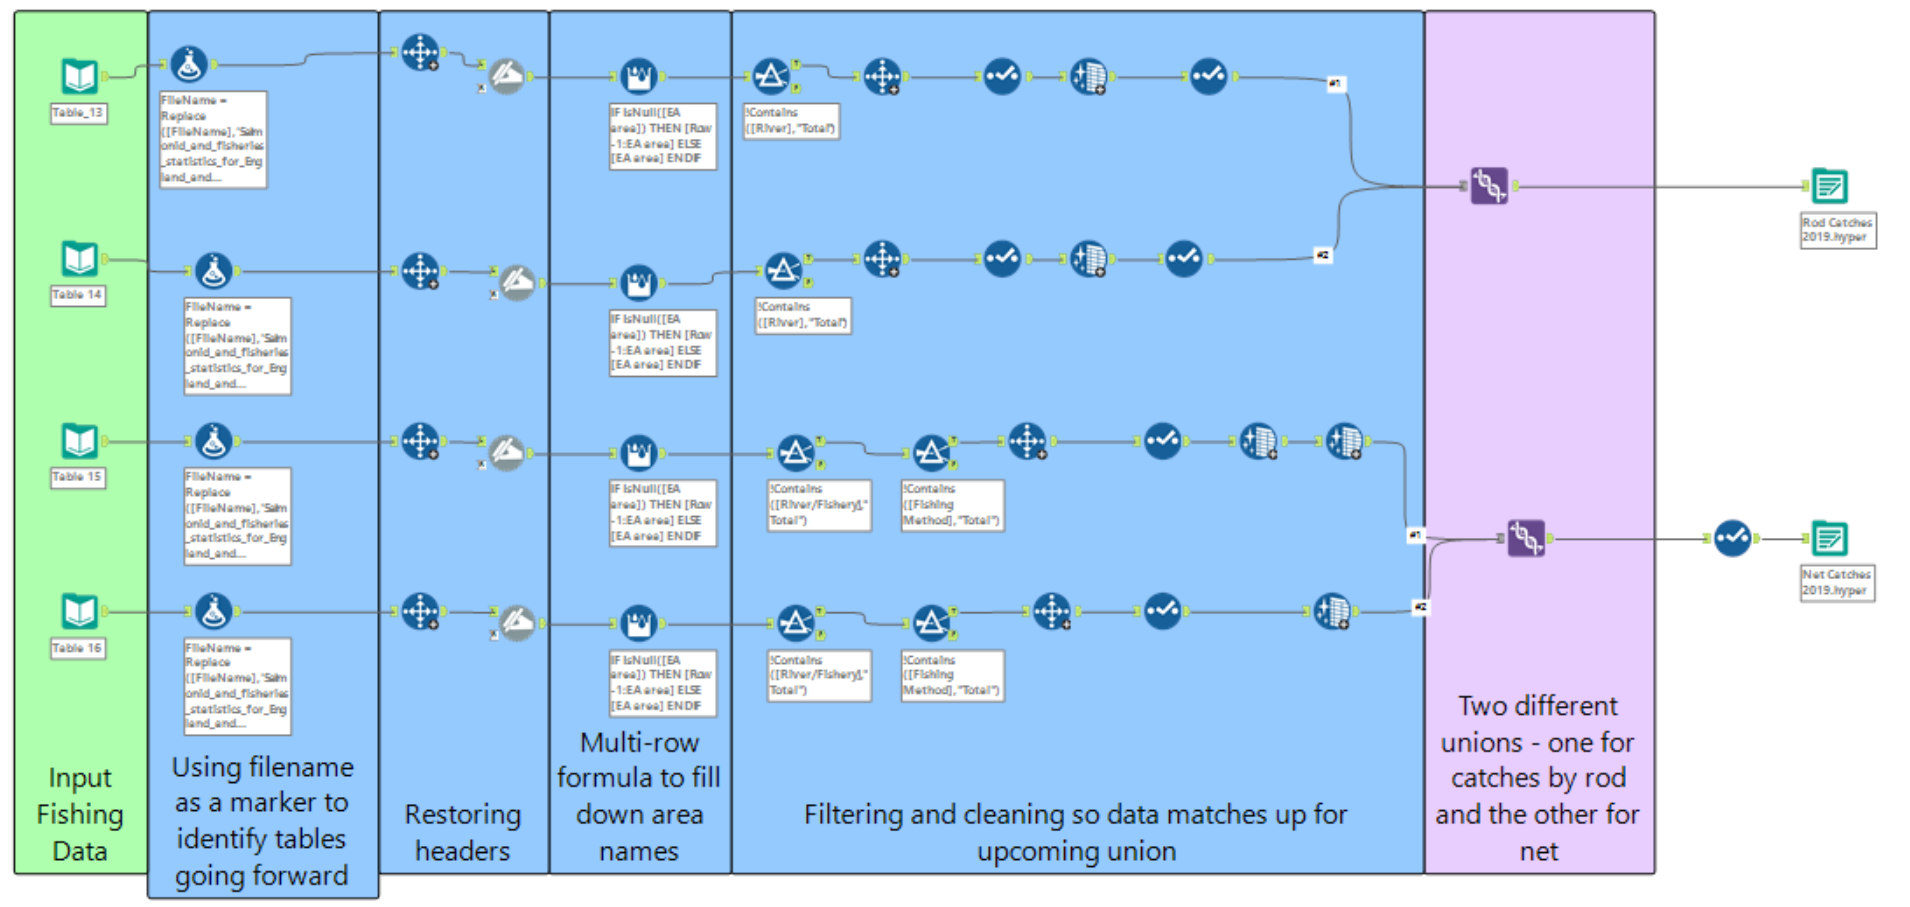
Now I knew I had to get 4 tables from this dataset to get enough data for the dashboard - but I started with just one to test a workflow and see what steps I took to clean the data. Knowing that the other three tables I needed were in a similar format, this meant I could save more time down the road by just using the same flow, with a few minor tweaks.
So, now the data was clean and ready to go it's time to jump into Tableau right? Wrong! This is where I start getting... experimental. You see, when Carl first gave us this dataset he mentioned there would extra bonus points for joining this data with geographic data for rivers in England. So I started scouring the internet for datasets that would fit the bill. Believe me reader I searched high and low, thought I hit the jackpot a few times just to run into a myriad of issues - and so it was at this point I decided to table this and come back to it after the dashboard was finished - and with a fresh pair of eyes I found something I could use! https://data.gov.uk/dataset/dc29160b-b163-4c6e-8817-f313229bcc23/os-open-rivers
Result! Now let's get to Alteryx and join this up -
Part 2 - Getting Experimental
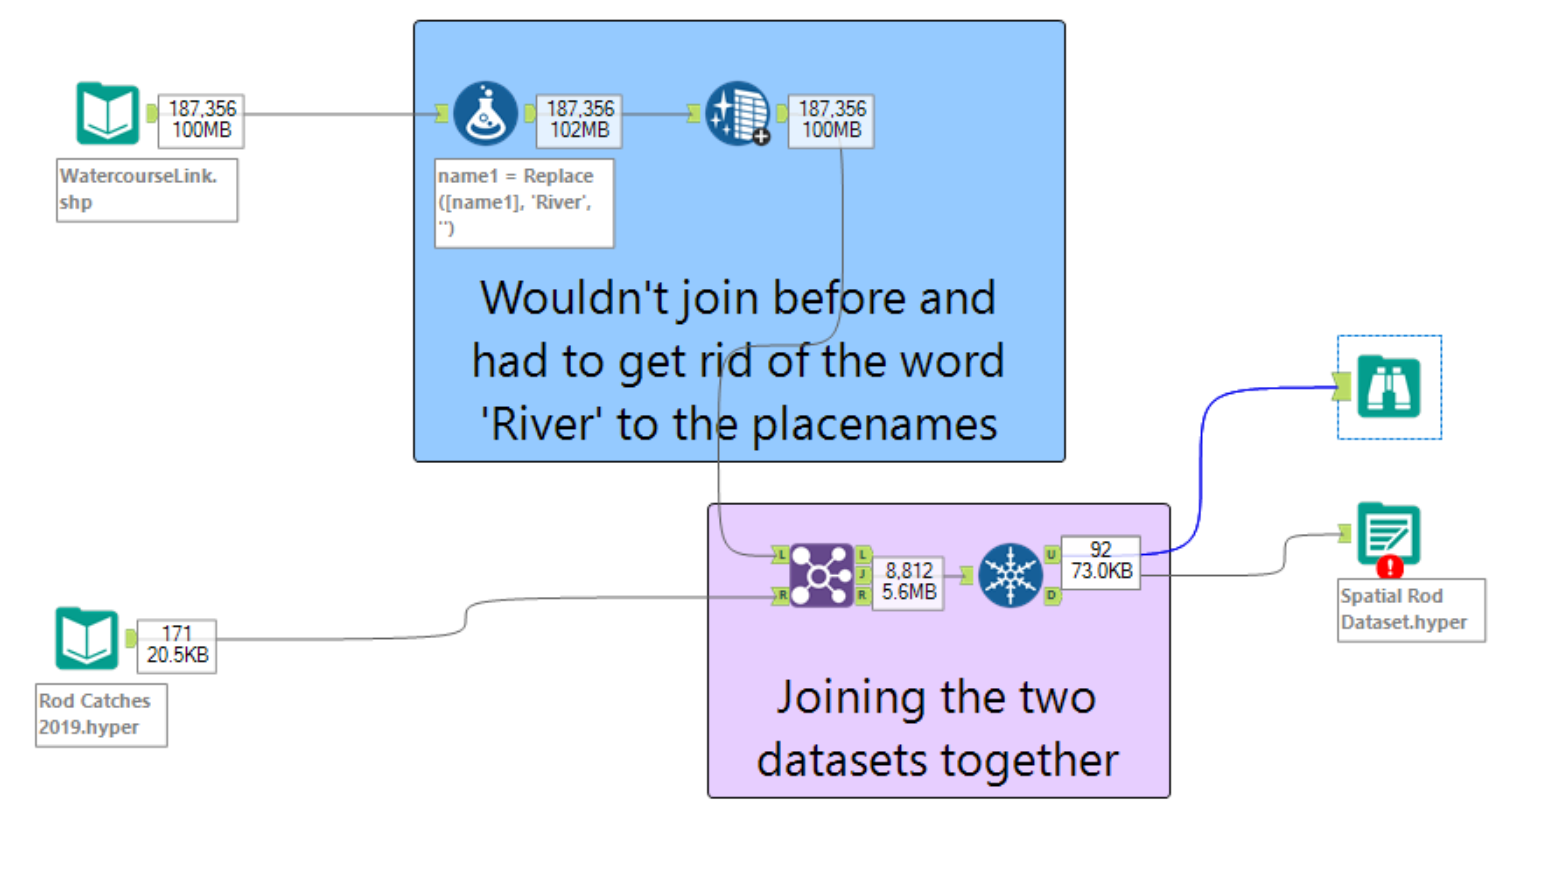
However, with time running out and a blog still to write - this dataset did not turn out so well - only giving me 80 river spots which were barely visible in Tableau. For this - I'm really interested to see what my cohort colleagues in DS26 and DS27 found.
And finally, after much chagrin - the dashboard:
Part 3 - Result!
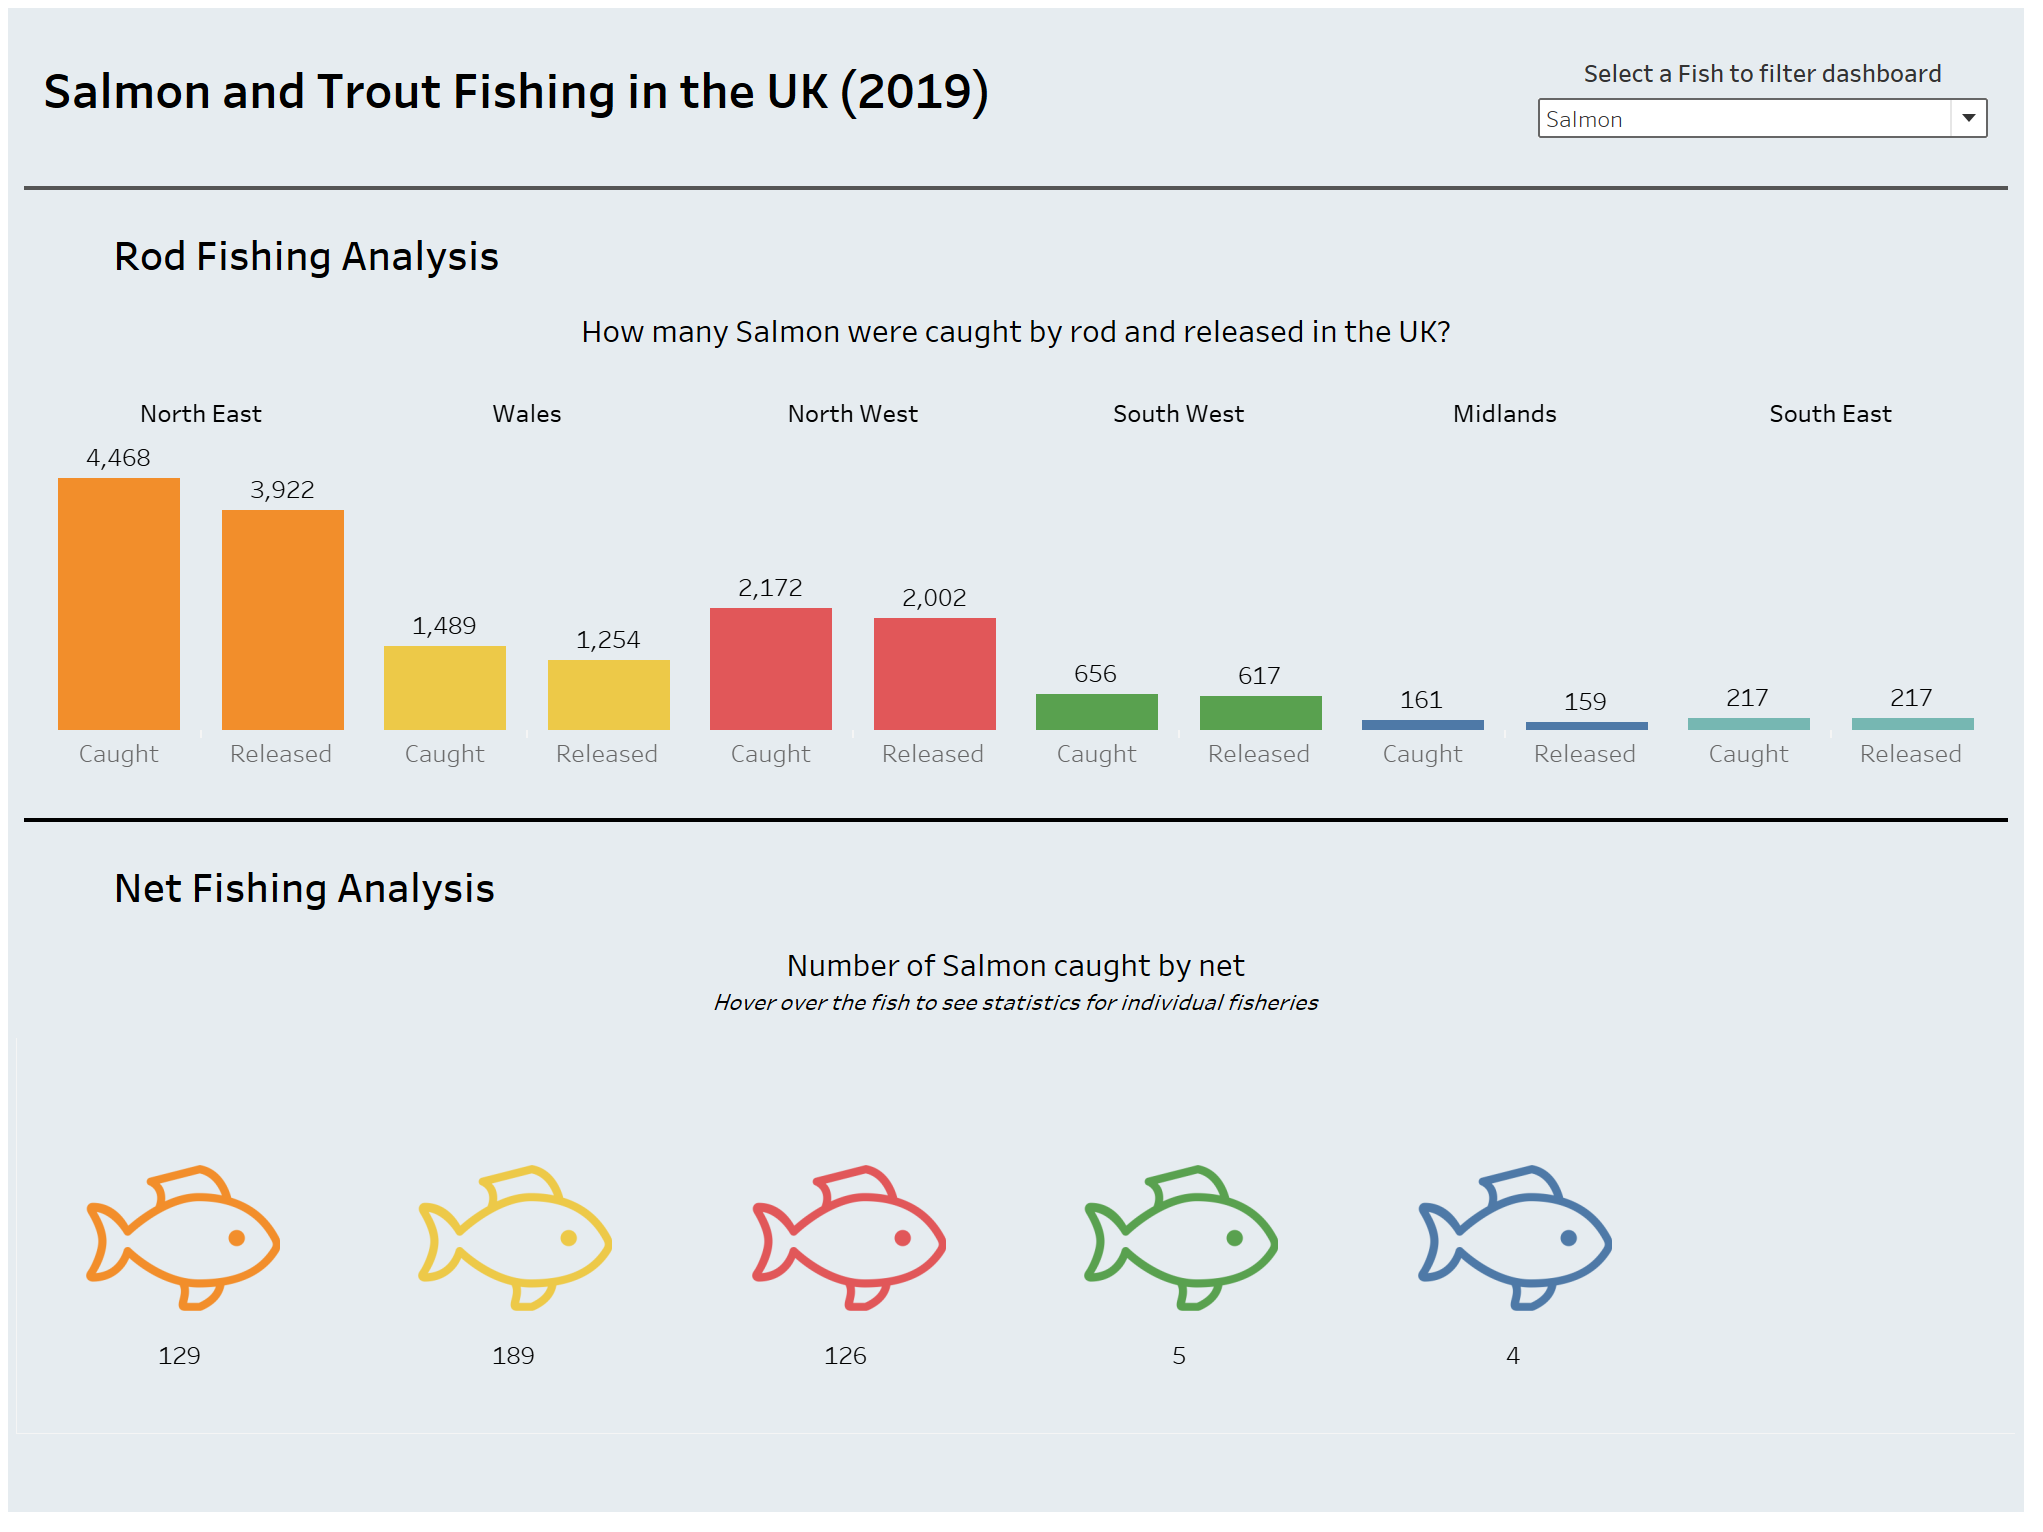
A simple analysis of the overall numbers of Salmon and Trout fished in 2019. The top half of the dashboard is dedicated to Rod fishing, and the bottom half to Net fishing. I've also added the ability to filter the whole dashboard to just Salmon or Trout, using a Parameter which will automatically update both charts. For the net fishing, I've also added the ability to hover over the fish and see which fisheries contributed the most in that area using a sheet inside the tooltip.
So - that's the first Dashboard Week challenge complete! If you'd like to play around with the dashboard, or maybe download the workbook to see it under the hood - please follow the link below to my Tableau Public page!