Hi all, and welcome to the second day of three of DS26/27's Dashboard Week! Our challenge was given to us today by Andy - the details of which you can see here: https://www.thedataschool.co.uk/andy-kriebel/ds26-27-day2
PART 1 - THE DATA PREP
Straight away there seems to be no rest for the wicked, as we had our first challenge of the day, downloading and seeing the data. The data (provided by the National Cancer Institute) was in a .dat format, leading to a lot of head scratching for me and my fellow colleagues. I for one had never seen or heard of the .dat file format - but a quick google told me I could change the file type name to whatever text-based file type I so desired. My first step was then to change it to a .csv, however the file was too big for Excel, and a quick glance at what I did have showed me that the data was not even put into columns.
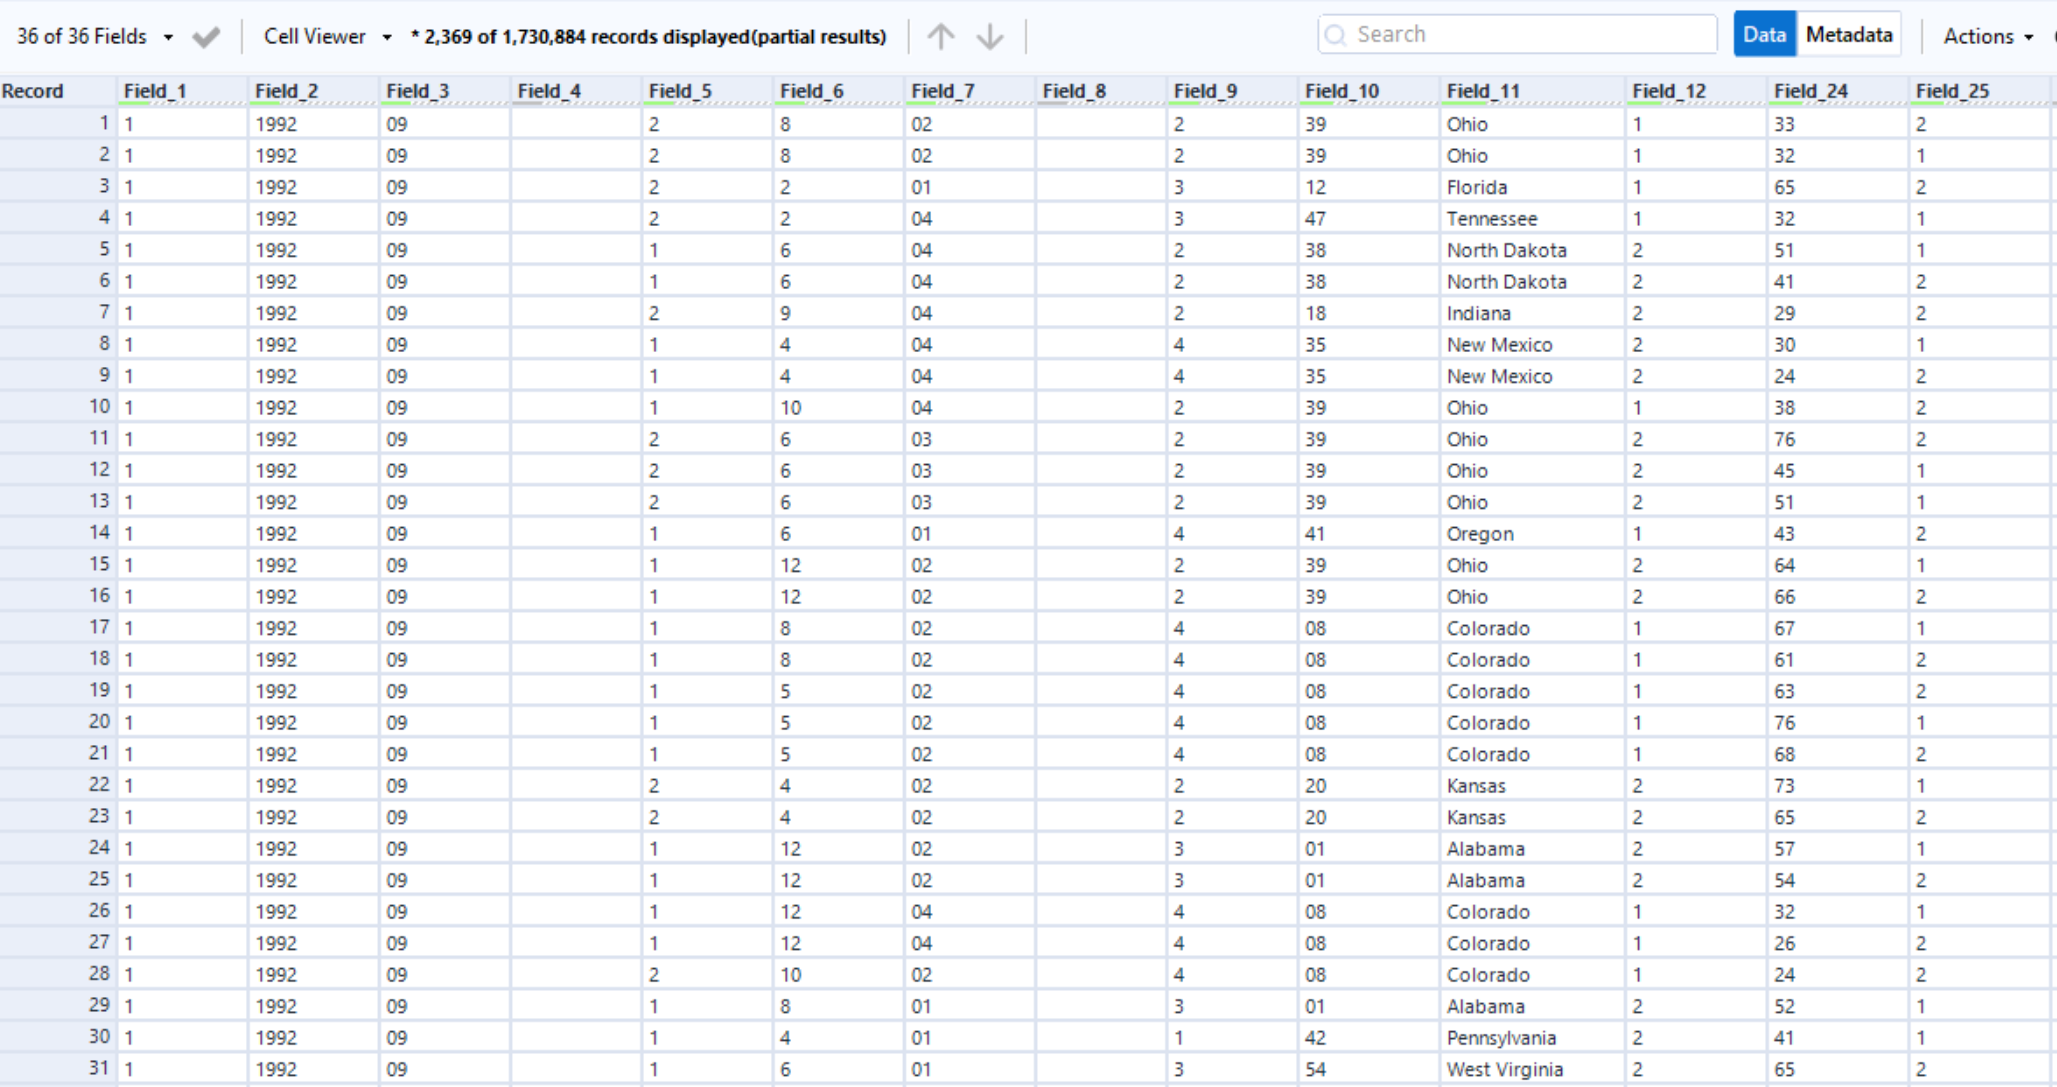
To combat this, I inputted the file into Alteryx, and read it in as a 'fixed width' file, which will then bring up this screen:
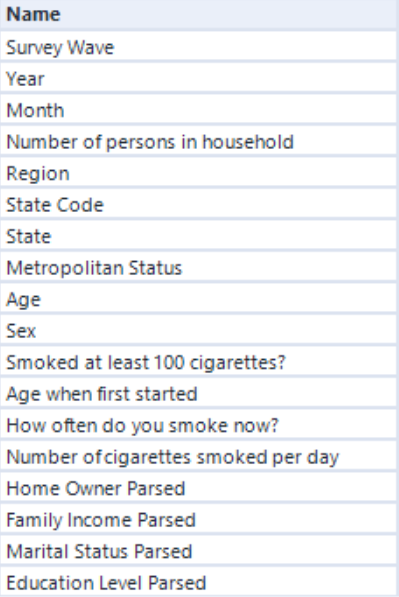
This feature of Alteryx was unbeknownst to me before today's challenge, but it does let you literally slice up the data into the columns you desire. So, with the data dictionary in one hand and Alteryx in the other, I got to work. That work then left me with this:
After which I used a lot of formula tools to translate those numbers that you see into plain English, so the data could be understood. Once again - the data dictionary came in handy as it gave an explanation for all the variables. This did take a long time however, and in hindsight I should have made more use of the multi-field formula for variables that had a similar schema.
PART 2 - INITIAL ANALYSIS
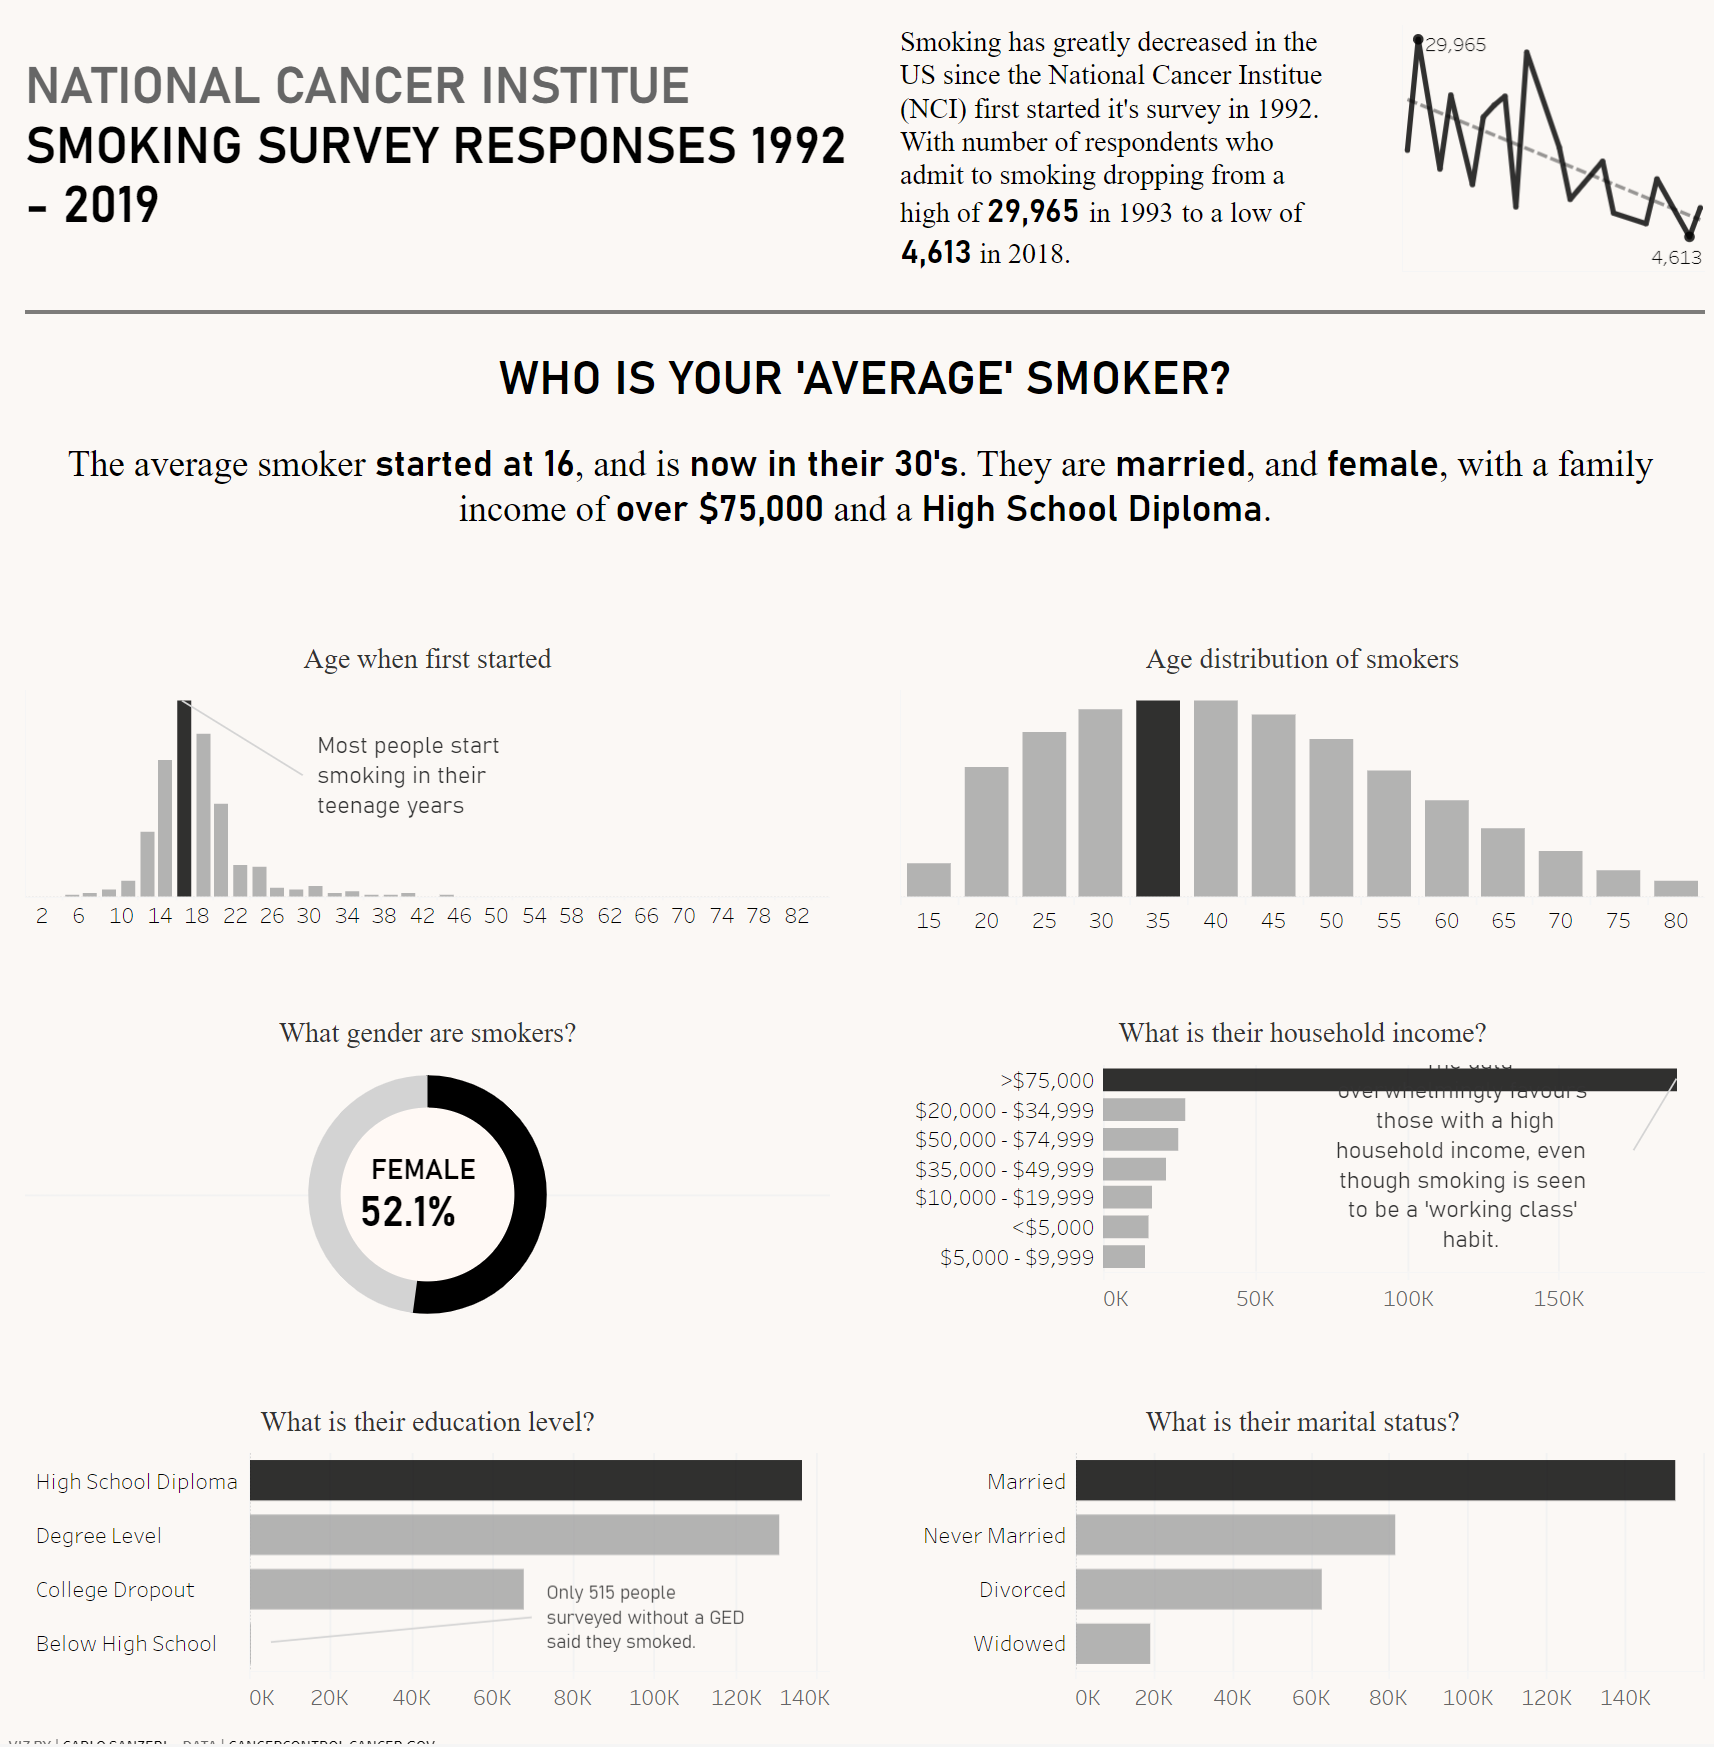
With everything sorted I then got stuck into Tableau, and started analysing the data. I started by going through each metric, seeing how many smokers there were for each one - I found this interesting as the data seemed to go against the pre-conceived judgments that one may have about smokers (especially in the UK). Some may see it as an activity for those who are male and working class (as a smoker myself I have no such notions) - but the data was telling me otherwise, and so an idea of a dashboard quickly formed into my head. My idea was to provide an overview of smokers on these key metrics, and maybe see how this compared year to year, and how things have changed since the beginning of the dataset (1992) to now. Quickly this idea started to change into what my dashboard then became, trying to bring all these metrics together to tell the story of 'Who is the 'average' smoker?'. I quickly made the adjustments, changed my colour scheme to something that I believe fit the bill, and got my dashboard up on Tableau Public in time for 3pm.
THE FINAL DASHBOARD
So that's all for day 2! If you want to have a closer look at my work please go to my Tableau Public page - link below: