


Today's task was to use map scraping and bring in the data in PowerBi. The data for this challenge came from the website Basketball Reference. We had to use data from 2002 to 2022 and we could also choose our teams.
As a basketball player and NBA fan, I found the task really fun but the main challenge was we had to use Power Bi. We had two sessions during our training and this week we also did some Workout Wednesday challenges in Power BI (PBI) but I'm still not used to all the functionalities PBI provides.
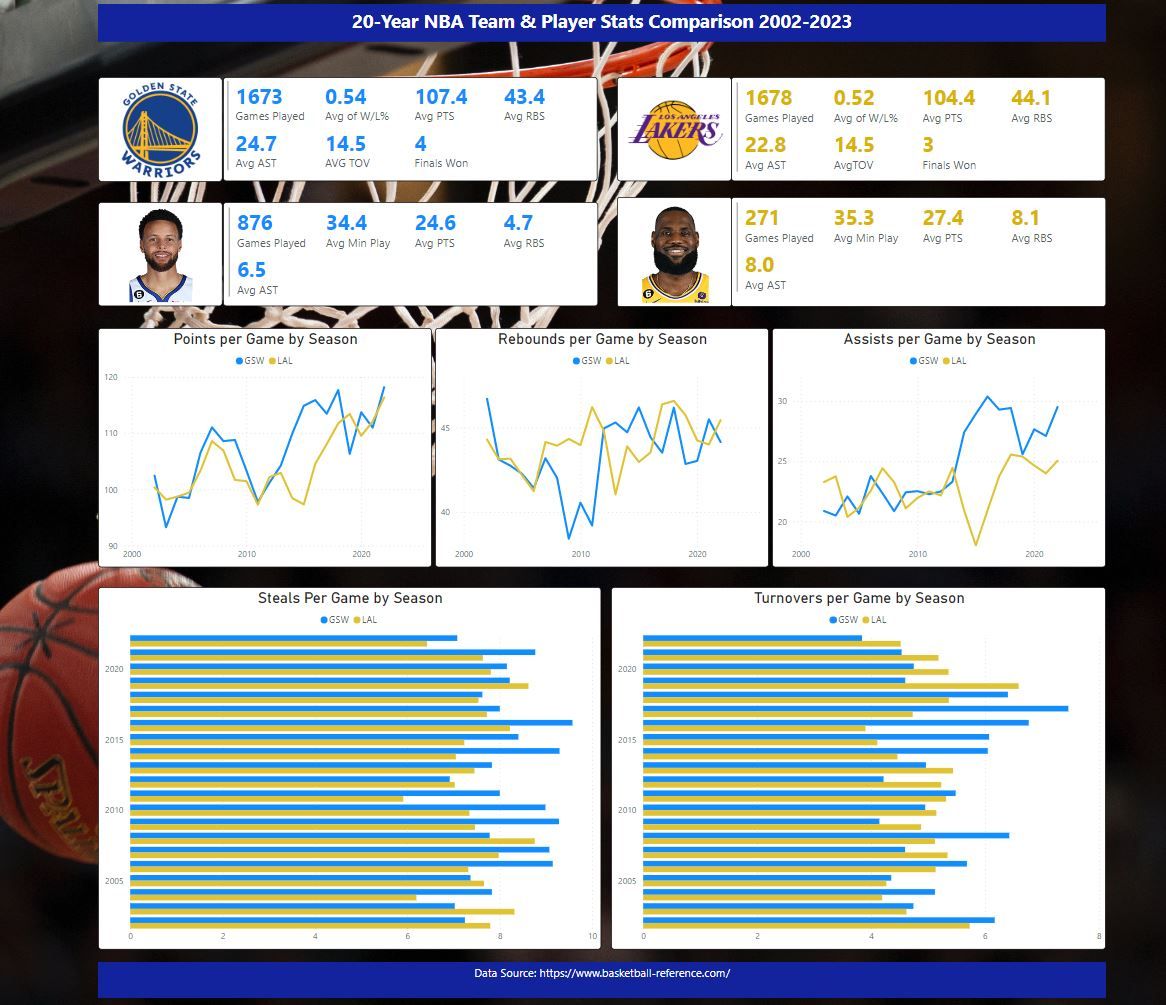
I decided to go for a comparison of the two most known NBA teams: Golden State Warriors (GSW) and Los Angeles Lakers (LAL) as well as its two major active players - Steph Curry and LeBron James. My main metrics were the number of points, rebounds, assists, and turnovers per game. In the end, this is what my report looks like:
Some of the challenges I met while working on this task was actually web scraping. I wasn’t able to add the tables using this method, instead, I downloaded the tables I needed and created the data model. I also tried to add the team logos and player photos using web scraping but unfortunately, it didn’t work. I think I spent more time on data preparation and formatting instead of getting familiar with the data and focusing on the analysis more.
There are a lot of opportunities for improvements but due to lack of time and spending too much time on formatting, I couldn’t make the report too interactive. One area for improvement is to add the player statistics per season so we can also see their yearly trends. Maybe I will work on improving the dashboard while I'm on the bench.