


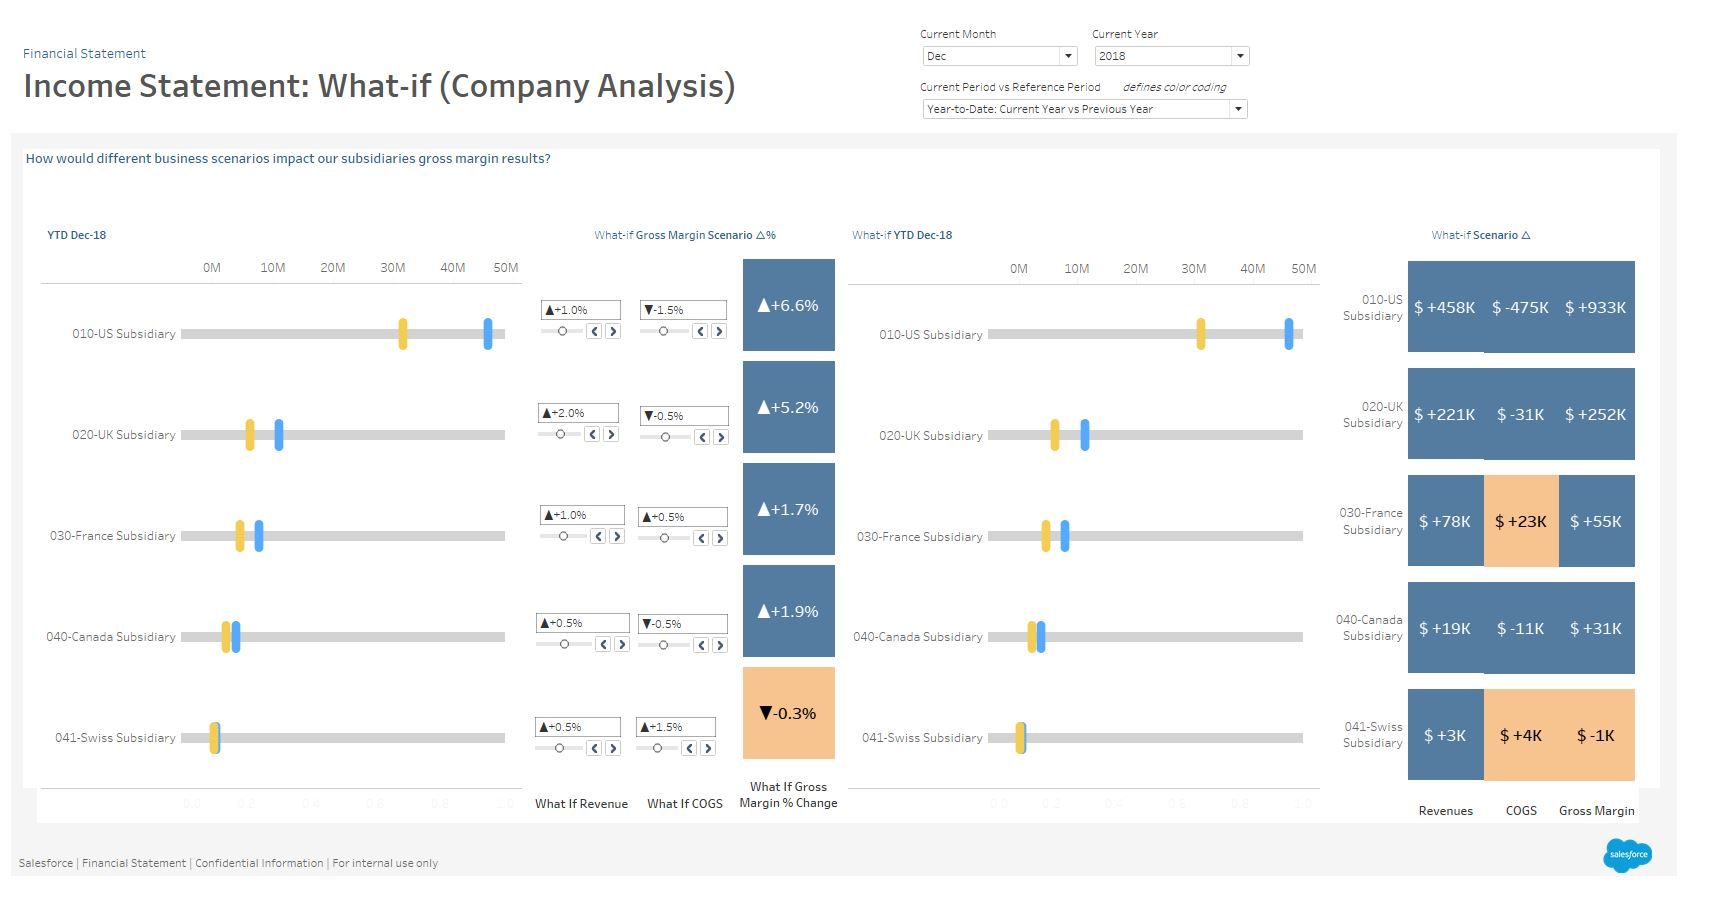
Today’s task was a bit challenging for me. We had to choose one of Season 2’s Real World Fake Data (#RWFD) based on Tableau’s Accelerators. The topics were the following: Financial Overview, Citizen Service Requests, Emergency Calls, and Diversity Score Card and we had to build new dashboards and answer existing and new questions with the data. Having worked with financial reports before, I thought I will quickly get familiar with the dashboards. I was wrong; the dashboards had so many calculated fields, and it took me a long time to understand all the measures. By the time I knew what I wanted, it was after lunch and I also had some issues trying to make a new calculation work that would compute a forecast scenario on a subsidiary level, what my analysis was based on: “How would different business scenarios impact our subsidiaries gross margin results?”. In the end, this is what my dashboard looks like:
Challenges:
Trying to understand the data and calculations was time costly and again I didn’t have more time for formatting and preparing the presentation.
Trying to update an already existing dashboard was not a good idea.
I also didn’t have time to replace the dataset with the new data but since it was fake data and the number of rows and values were the same, I thought it wouldn’t make any difference.
Improvement tips:
Have a look at all the topics before choosing your topic.
Relax, only one day left of Dashboard Week!