In my previous posts, Tableau Tip: Calendar View Part 1 and Part 2, I explained how to build vertical and horizontal calendar views. This time I’ll show you what to do if you’re missing some dates and also how to build a year view with all 12 months.
EDIT: Because this ended up being quite a length post, I decided to split it. For 12-month calendar, go here.
If you’re stuck, check out my public workbook with all the views described and don’t hesitate to contact me.
Missing dates
In Part 2, when we added the day number as Label we realised we used all years which messed up the view. To solve that we filtered the data to only use one year. That in turn showed how much data was missing:

Let’s deal with it.
How to
First, you need to specify the range of dates you’re interested in. Let’s say we want to show all dates in 2018. As Tableau can’t generate them for us, let’s go to Google Sheets or Excel. In the top cell, I put ’01/01/2018′. Select that cell and drag by that little square in the bottom right corner down to 365th row or until you reach ’31/12/2018′.
Go to Data Source view in Tableau and add a connection to you existing data source:

If it’s your first time connecting to Google Sheets (it is for me!), you’ll need to sign in to Google in your browser and should see something similar in Tableau Desktop:

Connect to your created sheet with all of the dates. Tableau will automatically try to combine your two data sets.

Add a join clause with Order Date and F1 (which should the only field in your date sheet, Sheet1 in my case, unless you changed that). We also want to do a right join:

You can also do a Full Outer join if you want to keep all data from the original data source, but since we’re limiting our data to 2018 for the purpose of this tutorial, I’ll stick to the right join.
Find you F1 field in the data preview and rename it to ‘Full 2018’.
Alright, now open the horizontal calendar built for Part 2 (or create from scratch; if you’re here, you might want to use Full 2018 field instead of Order Date and it should save you a few clicks). As a reminder, this is where we left off:

Right-click on Full 2018 and replace MONTH(Order Date) and select MONTH from the pop-up window. Doesn’t seem to change much. Do the same for WEEKDAY. It looks weird. Let’s not worry and continue…

Before we did the same thing for Month Week, we’ll need to update our two calculated fields as they were using Order Date. (For explanations on what the calcs are doing, see Part 2.) There’s a chance it would work without correcting those calculations, but let’s keep thing clear.
Month Week calculated field looked like this:
DATEPART('week',[Order Date]) - [Month Start Week] + 1And we want to change Order Date to Full 2018:
DATEPART('week',[Full 2018]) - [Month Start Week] + 1We see that Month Week uses Month Start Week, so let’s edit from
{FIXED MONTH([Order Date]): MIN(DATEPART('week', [Order Date]))}to
{FIXED MONTH([Full 2018]): MIN(DATEPART('week', [Full 2018]))}Now that the calculations are correct, let’s remove the YEAR(Order Date) from filters card and DAY(Order Date) from marks card. If you did the full outer join, you might see some nulls in the view, just filter them out.

Yes!
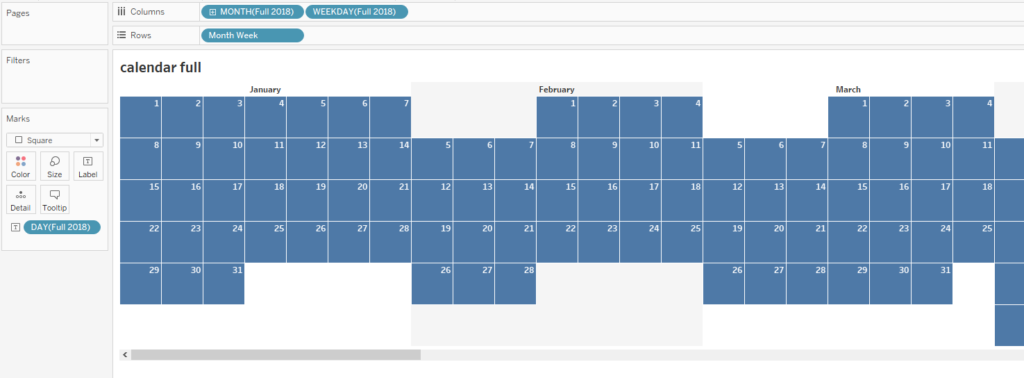
Now we’re left with some formatting: I’ll remove the names of the weekdays, add DAY(Full 2018) on the Label on marks card and change the size of the cells to get squares. Here’s what I got:

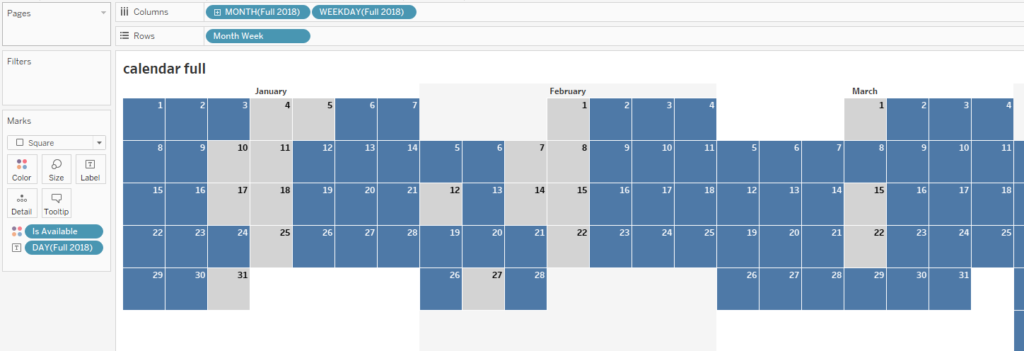
Neat. But I’m not so satisfied. Let’s say you want to show which data is available. To do that, we’ll need another calculated field called ‘Is Available’:
NOT ISNULL([Order Date])This calculation will return True for rows with available data and False otherwise (we’re checking this by Order Date but we could use any of the fields from the original data set).
Now drag the Is Available field on Color on marks card and format the colors, so that False is a very light grey and True is blue:

Well done!
