One of the useful chart to show comparison of multiple years performance or metrics is a cumulative chart. Say I want to compare the cumulative Sales for the last year and current year up to the current month. The calculation is straight forward:
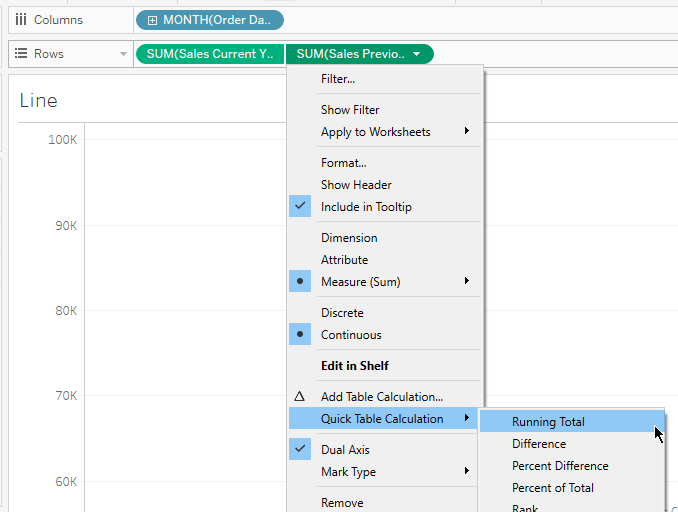
Bring current sales and previous sales field into the rows column and date set in the discrete month. Then do a dual axis and synchronize them. After that, do a quick calculation of running total for both Sales fields
However, I ended up with a chart like this:
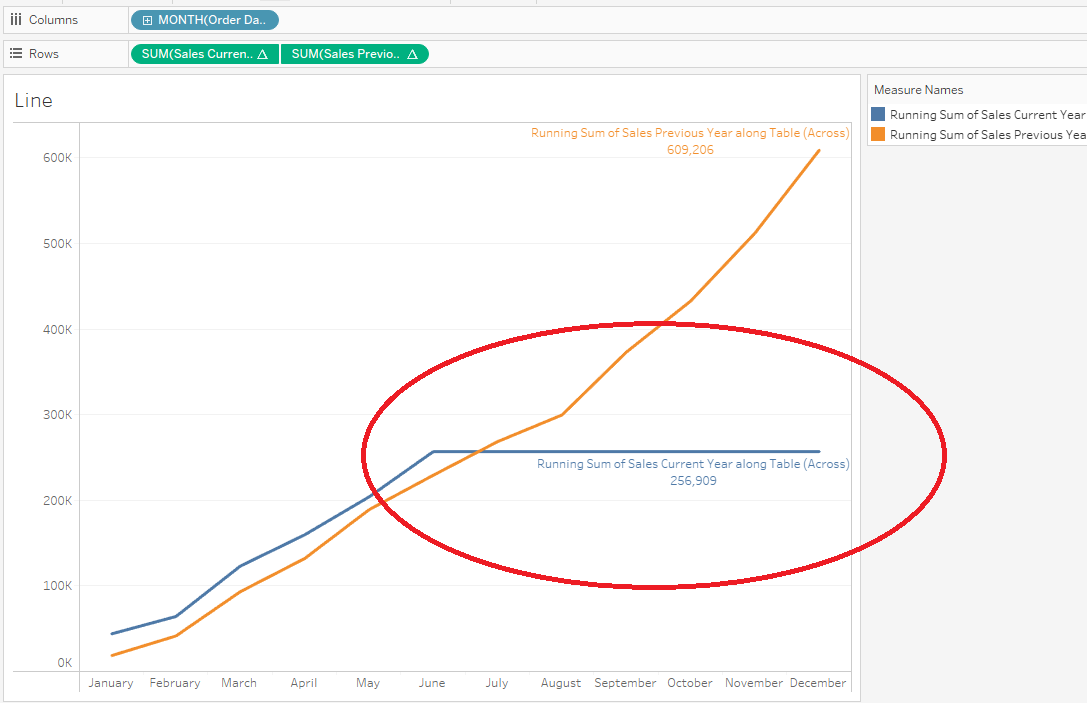
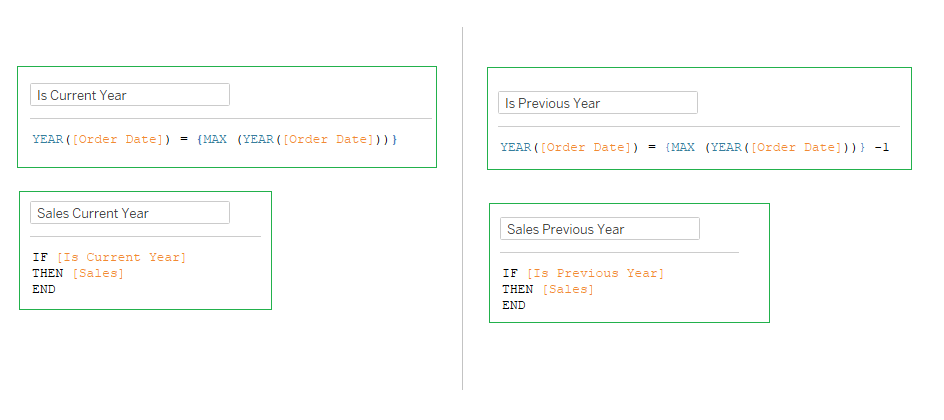
Apparently, since the current year is just in the middle of the year, Tableau displayed this line to bring the metric of the current month until December. So to better display this, we must create another calculated field that will display data only up to the current month. Here's the calculation:
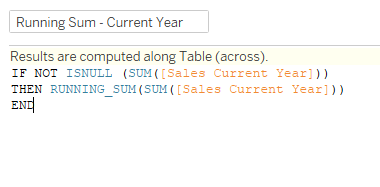
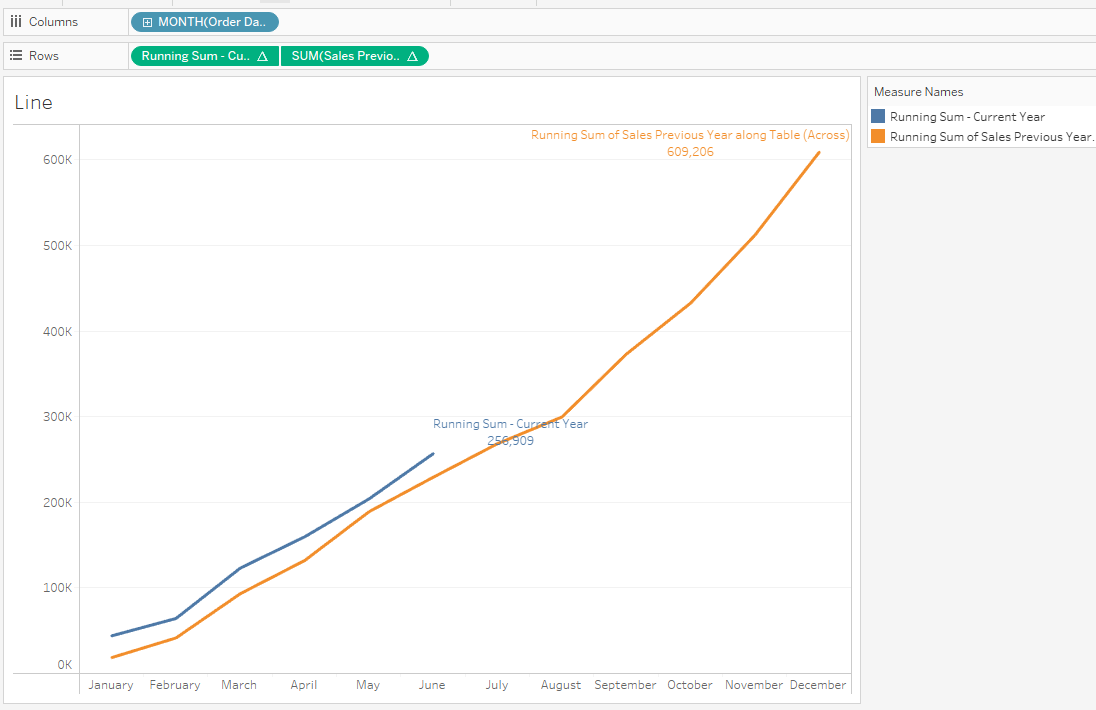
Replace this with the current month field then, there you go, we get a better representation of the cumulative sales last year vs current month of current year.