I came across a project where I have to color multiple metrics with some condition, meaning with different ranges for each metric. This is an example of a SEO traffic light scorecard.

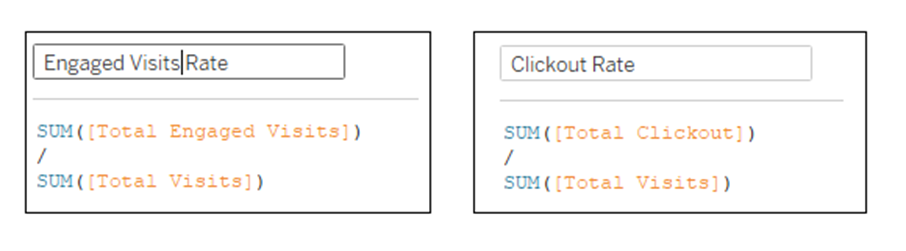
First step is to compute for the rates or metric needed. Engagement Rate in SEO is simply the sum of engaged visit over the sum of visit. And similarly Clickout Rate is the quotient of total clicks and total visit.
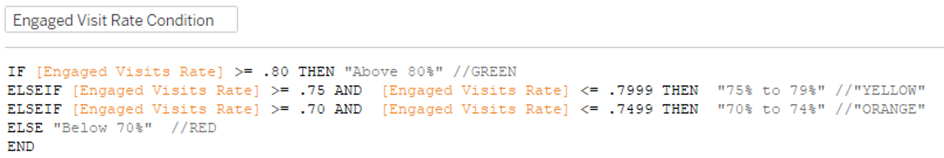
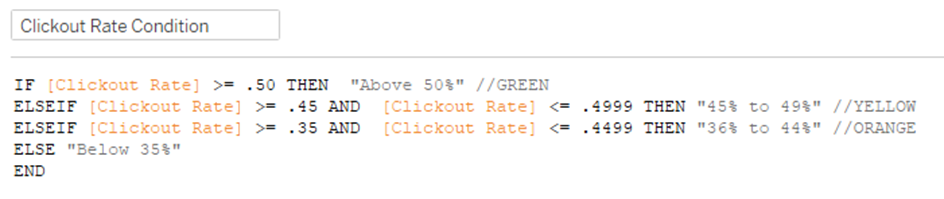
Then we use this rate to create conditional calculations and for their labels.
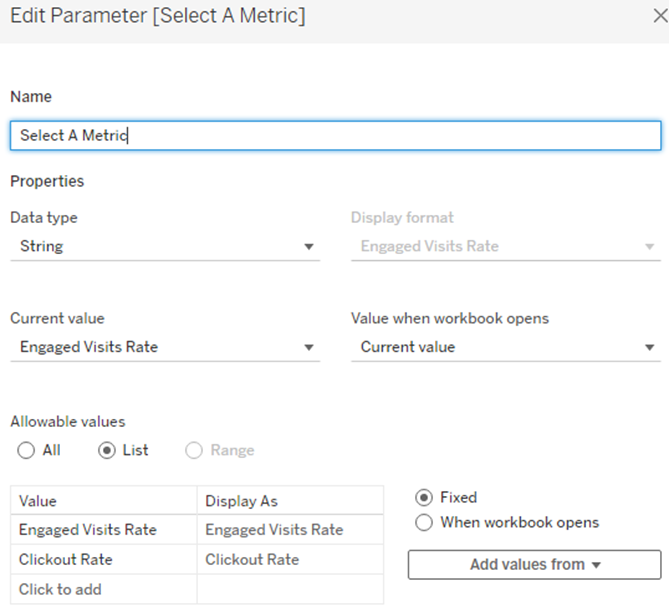
Create a parameter to allow users to choose between two metrics (or more) and show the parameter to view.
And for the parameter to work, we need to create a calculated field to call on the condition. And we will use this to assign our colors.
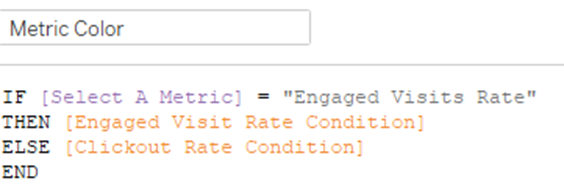
To build the viz, lets bring "Product" field to columns and "Site Category" to rows. Bring "Metric Color" field to Colour’s on the Marks card and change the shape to filled circle. And there you go. Toggle on the parameter to shift from one metric to another.
I recreated the project using mock data. Click here to see the completed dashboard in my Tableau Public page.