


Tableau Prep version 2018.1.1 was released in April this year. Six months on and five versions later, Emily Chen introduced DS11 to Tableau Prep 2018.3.1.
My first thoughts? Its user interface is modern and intuitive with some great functions but there are some limitations. Tableau Prep won’t surpass Alteryx in power at the moment but definitely has potential!
Being a new software, many of you probably haven’t given it a go yet. In this guide, I will run through everything you need to know to get started! See my previous posts on getting started with Alteryx (link) and Tableau Public/Desktop (link).
Now, if you haven’t got Tableau Prep downloaded yet, you can get the free trial here. Otherwise, start up Prep and let’s get started!
Start Screen
The first thing you’ll see when you start up Tableau Prep is something like Figure 1.
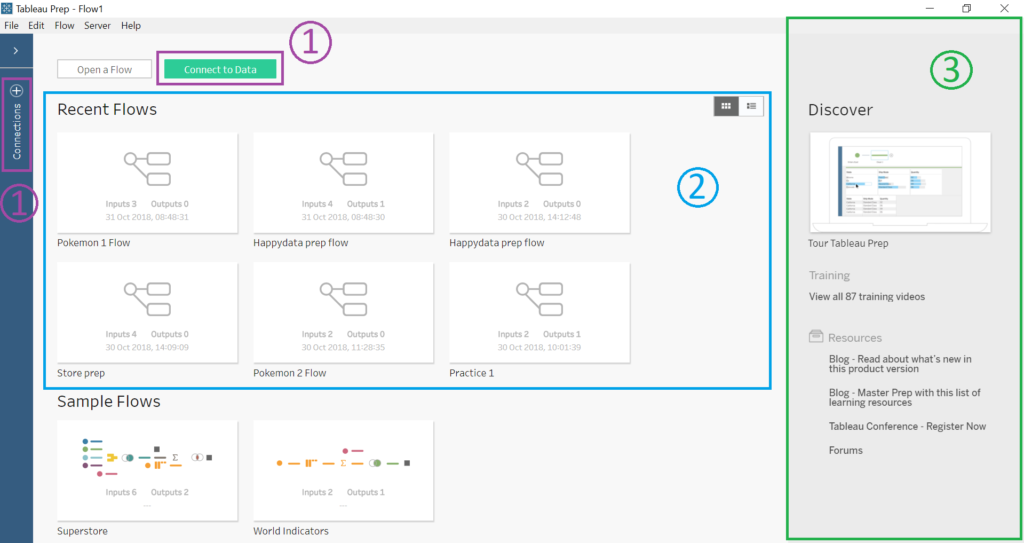
Figure 1. Tableau Prep start up screen
Figure 1 – No. 1
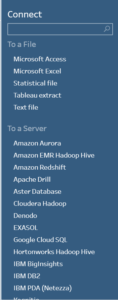
Figure 2. Connect to data pane
To start cleaning your data, you’ll need a data set to connect to. To do this, click on either button shown in Figure 1 (Number 1). There are three main ways of connecting to a data source in Tableau. Clicking this button gives two ways of connecting to a data source (Figure 2):
“To a File” – This means connect to a file that is static. This can be an Excel, text file, etc…
“To a Server” – Data sources taken from a server will change automatically in your workbook if a change is made to the original data.
Figure 1 – No. 2
Here you will see the flows (workflows) you have opened in the past. Since this is your first time (or one of) using Tableau, you may not see anything here.
Figure 1 – No. 3
This is the “Discover” panel. You will find loads of links to great training material and information about upcoming conferences and the like.
Input Your Data
Now, connect to data! I will be using a Pokemon Excel file created by Emily Chen for training purposes. Figure 3 shows the screen you will see after connecting to a data source.
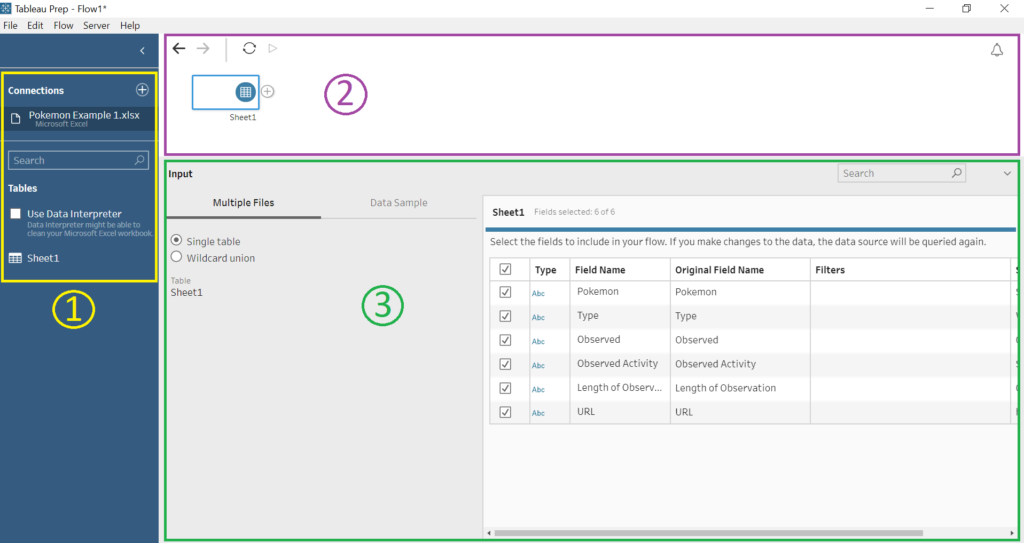
Figure 3. Main screen with input tool
Figure 3 – No. 1
This is your Connections Pane. Here you will see a list of files you’ve connected to (for me, just Pokemon Example 1.xlsx), the Data Interpreter and all the sheets contained in your file (for me, there’s just Sheet1).
Figure 3 – No. 2
This is your workspace, or view, where all tools of your flow will sit. If there is no sheet in your view currently, drag over a sheet from the Connections Pane.
Figure 3 – No. 3
This is where you will see your data and your configuration options. For the input tool currently in the view, you can choose to input multiple files and whether you want to sample or use all your data. Other tools will have different options.
Start Cleaning!
To start cleaning your data, click the plus (+) button next to a tool (Figure 4) and select another tool. As the input tool doesn’t actually let you see your data, click “Add Step” to see it. Figure 5 is what you’ll see after adding the “Add Step” tool.
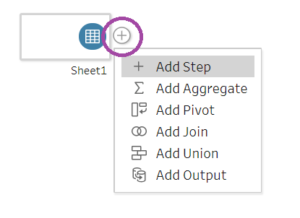
Figure 4. Add a tool using the + button
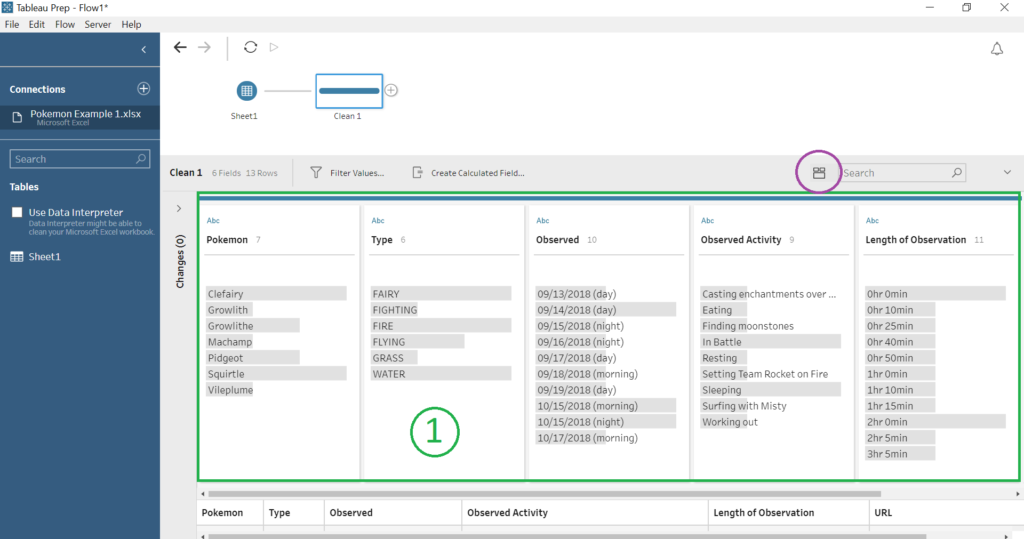
Figure 5. Adding a step
Figure 5 – No. 1
This is your Profile Pane. It shows the fields in your data and a summary of the values within each field. To switch to a row format (Figure 6), click the purple button shown in Figure 5. Switch back to the Profile Pane by clicking the button again.
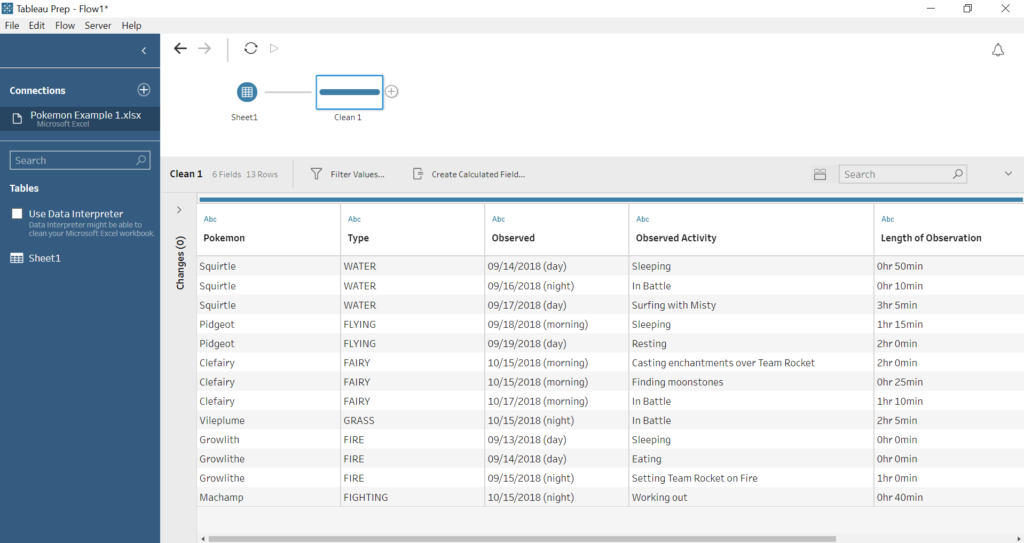
Figure 6. Data in row format
Ta-da! You should now have enough to go on to start cleaning your data. In my next blog post, I will go over how I cleaned the Pokemon dataset from this blog and showcase some great Prep functions.
Happy data prepping!
Louise
Check me out my blog feedmedata and follow me on @FeedMeData_